


Last year I published a framework to locate where AI agents would create value first. The method was simple: break work into tasks, map tasks to occupations, and use wage pools as a practical proxy for market size. The premise was that if agents finish work, the market is the labor they replace or accelerate. Here are links to the slides and underlying data: slides, data, methodology
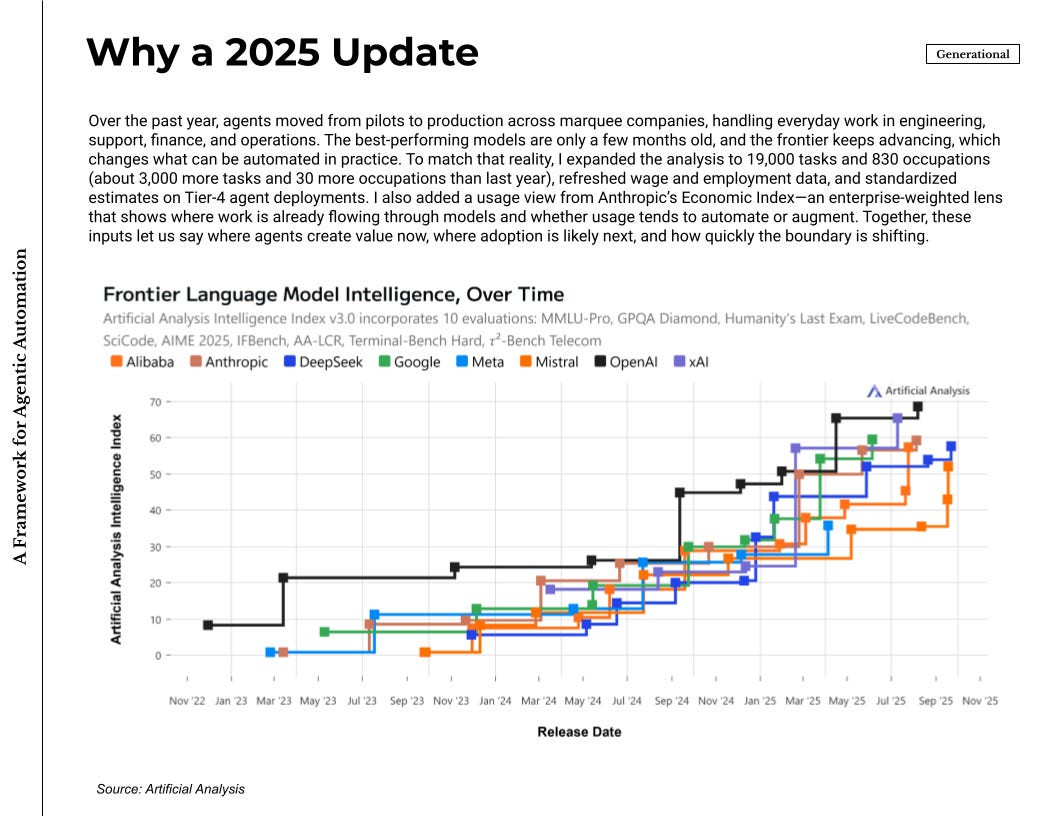
This update reflects how quickly the space has moved in practice. Agents are no longer a handful of demos. They run in production at well-known companies and cover routine work in software development, customer support, finance operations, and other structured processes. Cursor, Lovable, and the likes are now well-known products seeing rapid adoption globally. ChatGPT now has agent mode and Codex while Claude Code is increasingly used for non-coding use cases. The best models are new, often only a few months old, and the frontier keeps shifting as context windows, tools, memory, and supervision improve. I also expanded the dataset to 19,000 tasks and 830 occupations—about 3,000 more tasks and 30 more occupations than last year—and new wage and employment data.
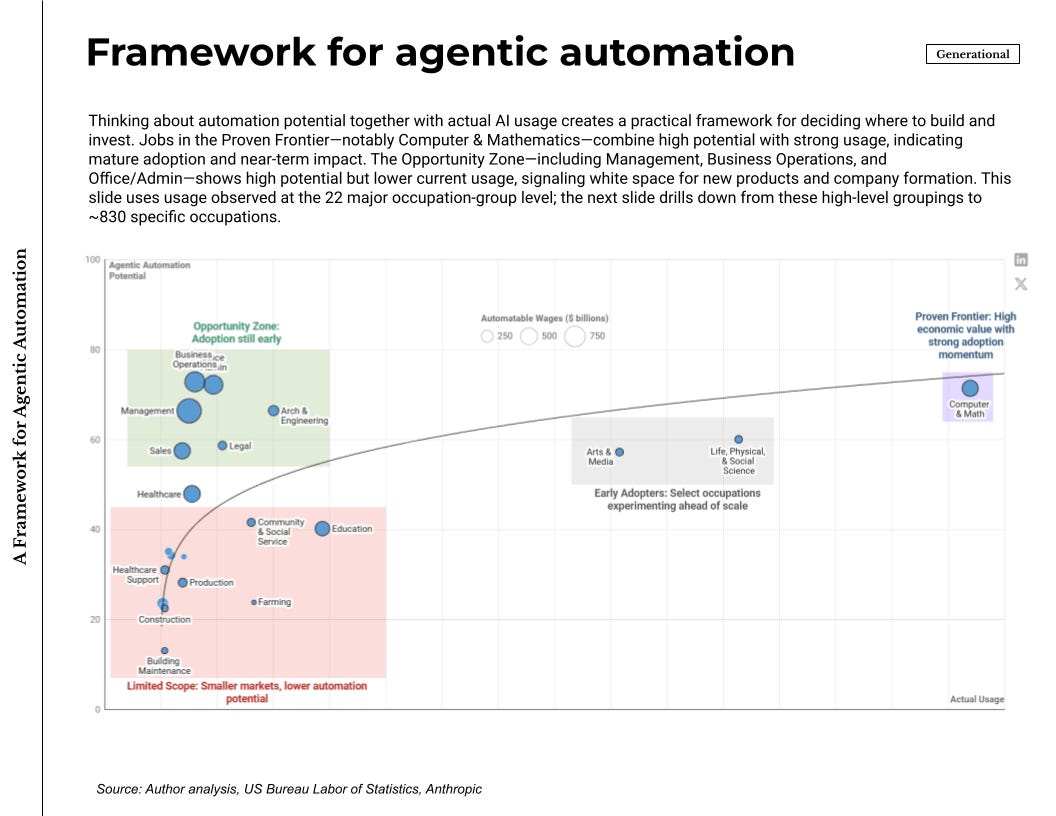
There is now a credible usage signal as well. Anthropic’s Economic Index aggregates 1 million conversations and maps it across the 22 major occupation groups. That lens matters because it tells us where teams already route tasks through models on the job, not just where models test well. Capability and usage together make the map more useful: one axis for agentic automation potential, the other for observed adoption patterns.
The picture that emerges is straightforward. Computer and Mathematics land in the high-potential, high-usage corner. Teams already push real tasks through agents there, which is visible in day-to-day engineering productivity and support operations. Management, Business Operations, and Office or Administrative work sit in the high-potential, lower-usage corner. The wage pools are large and adoption is still early. That is where new products and companies should grow1.
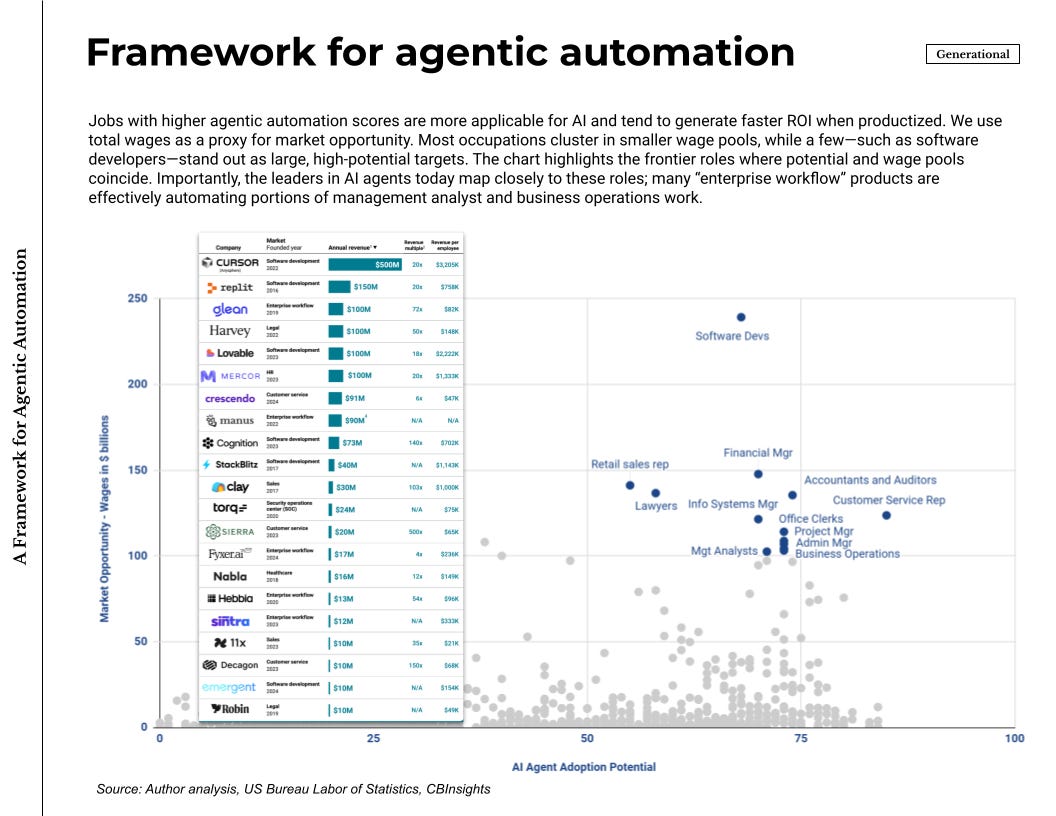
Because usage data is grouped at the major-occupation level, practical targeting needs more detail. The detailed occupation-level view pairs potential with wage pools across roughly 830 roles and shows where a product can attach to outcomes and budget. Most roles sit in smaller pools. A few dominate and match what we see in the market: software developers; customer service, accounting and audit, information systems management, project management, business operations. These are the places where agents translate cleanly into tickets closed, tests added, reconciliations completed, approvals moved, and minutes saved—and where pricing can anchor to time or output rather than seats. The fastest-growing agent companies lined up with this list, which suggests the framework has been a useful guide rather than a retrospective label.
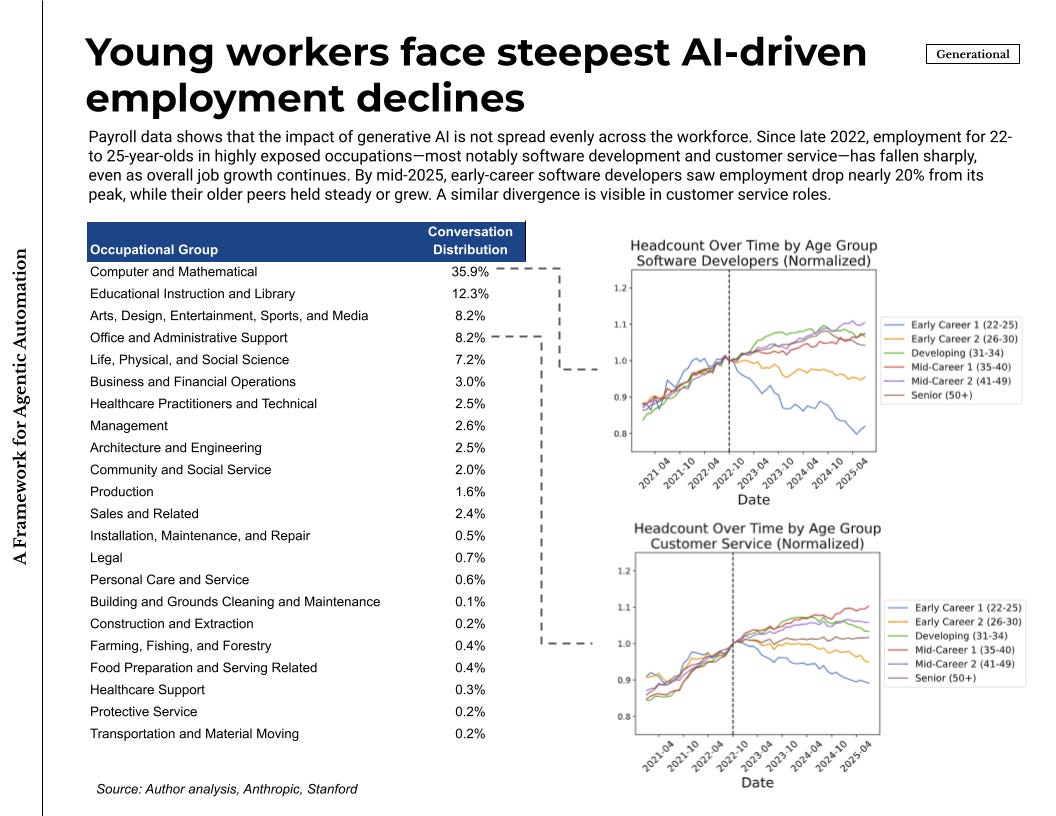
There is also new & convincing evidence on how AI, and consequently agents, is affecting the job market. Using high-frequency payroll records through mid-2025, researchers examined employment by age and by exposure to generative AI. Since late 2022, employment for workers aged 22–25 declined in the most exposed, automating occupations such as software development, while older cohorts in the same jobs continued to grow. Customer service shows a similar split. Occupations where usage is primarily augmenting do not show the same decline. This does not settle every long-run question, but it is a timely signal that agents are already taking a share of entry-level tasks in the proven corner.
Last week, I wrote about a high-level view of how to invest in AI across public and private markets, and across active and passive approaches.

This can be the roadmap for active private investing. Use the same discipline, now with sharper signals. Start with wage pools by role and overlay observed usage as frontier models turn over faster and policy controls mature. Judge products by whether they finish work inside systems of record and expose measurable outcomes. The practical takeaway is the same as last year, now with better evidence: act where potential and usage already overlap, and build into the gaps where potential is high and usage is beginning to rise.
Curated reads:
Two caveats matter. Usage data is not a census; it reflects who appears in the dataset and which tasks people choose to externalize. Wage pools are a proxy for demand, not revenue. Treat this as a working map that I’ll refresh as capability and adoption change.
Very good. I just wonder what proportion of your 19,000 tasks relate to handling authorisation checkpoints inside end to end process steps. My gut says that automating component tasks won’t generate any overall productivity benefits as seen by an organisation, just that the choke points will change. Unless of course process flows are already getting redesigned.
My questions were based on the work of Sangeet Paul Choudary in his book “Reshuffle”, especially the shipping containers on long distance travel (one contract for the end to end trip and no losses or delays or per trip leg contracts to negotiate). So simplifying the system has the major productivity benefits. Not just AI, but in places where use of AI components can grease the North Star led key processes through timely data flows.
Usually it’s the startups that force through the changes. Most orgs are not designed to handle disruptive changes well.