


A bubble occurs when asset prices detach from underlying value and then collapse. The challenge is that we can only confirm a bubble in hindsight—at the time, elevated prices might reflect genuine value or speculative excess, and distinguishing between them is the challenge.
The standard approach is to examine demand and supply separately. On the demand side: is there real economic value being created, or are people buying assets purely because they expect prices to rise? On the supply side: is capacity being financed in ways that can survive if assumptions change, or is the capital structure fragile?
Bubbles can form from either side. Tulip mania and Crypto 2021 were demand-side bubbles—speculative buying untethered from any use value. The 2008 housing crisis was partly a supply-side phenomenon—real demand for housing existed, but the financing structures couldn’t survive a modest price decline. The dotcom bust had elements of both: real demand for internet connectivity, but overbuilt capacity financed on revenue projections that never materialized.
For AI infrastructure, the demand side is the easy part. The evidence for real economic value is substantial and growing. The interesting question is on the supply side: whether the capital structure financing the buildout can survive the assumptions embedded in it.
Demand: Where the Evidence Points
The case for genuine demand rests on observable business impact, not projected future value.
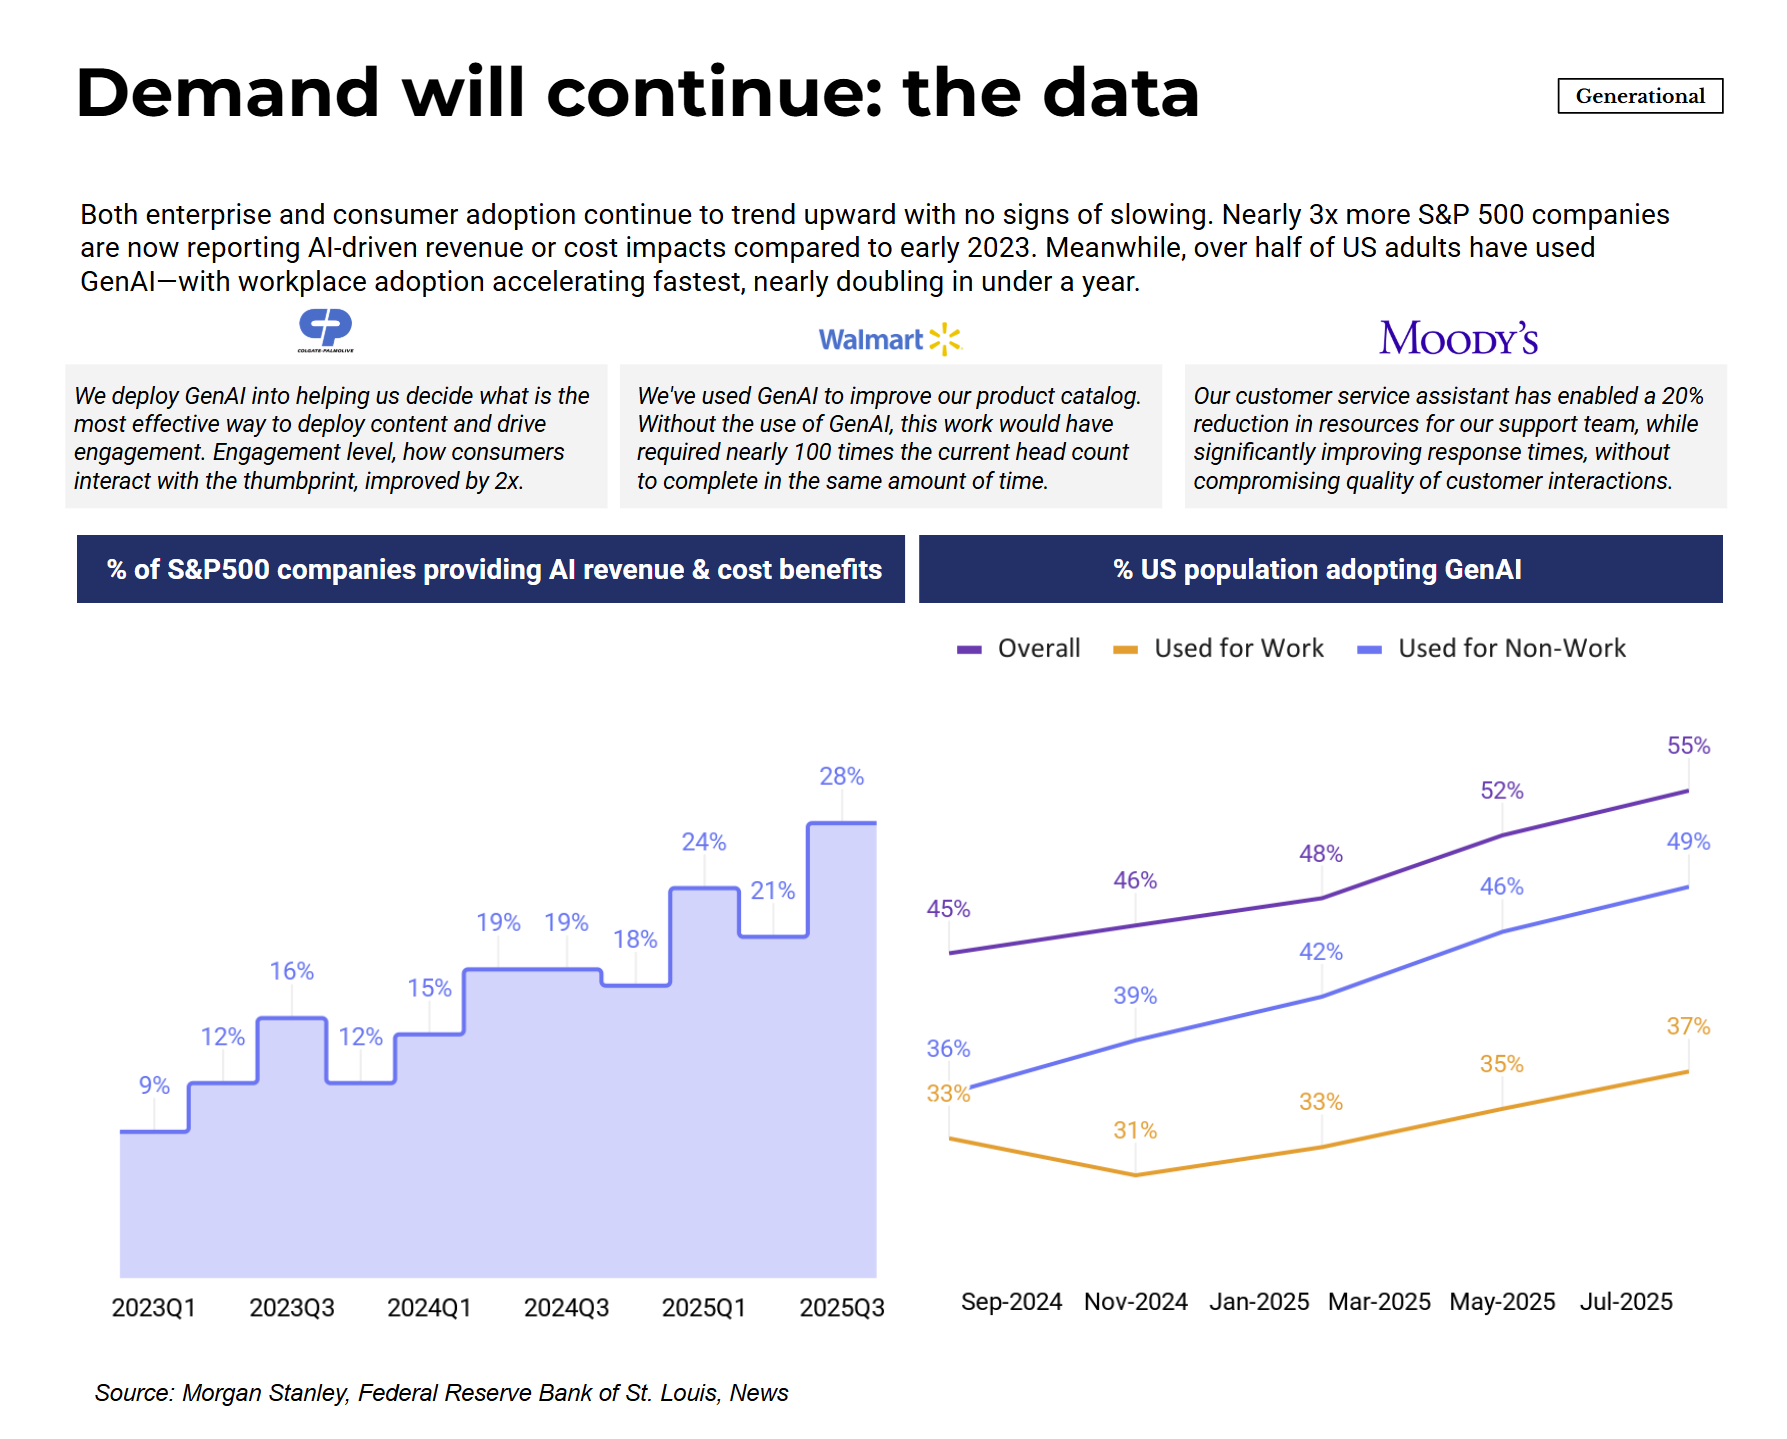
What these numbers represent is companies disclosing AI-driven financial impact in earnings calls—statements made under securities law, not marketing materials. The tripling of companies reporting AI benefits since early 2023 reflects actual deployment reaching the income statement. When Walmart says GenAI replaced work that would have required 100x the headcount, or Estée Lauder reports 31% ROI improvement on media campaigns, these are claims with consequences for executives making them. The investor relations teams and other internal teams vet and validate what executives say publicly.
Consumer adoption data reinforces this. Over half of US adults have used GenAI, with workplace usage nearly doubling within a year. At 900+ million weekly active users, ChatGPT alone has reached a scale where “will people use this?” is no longer a relevant question.
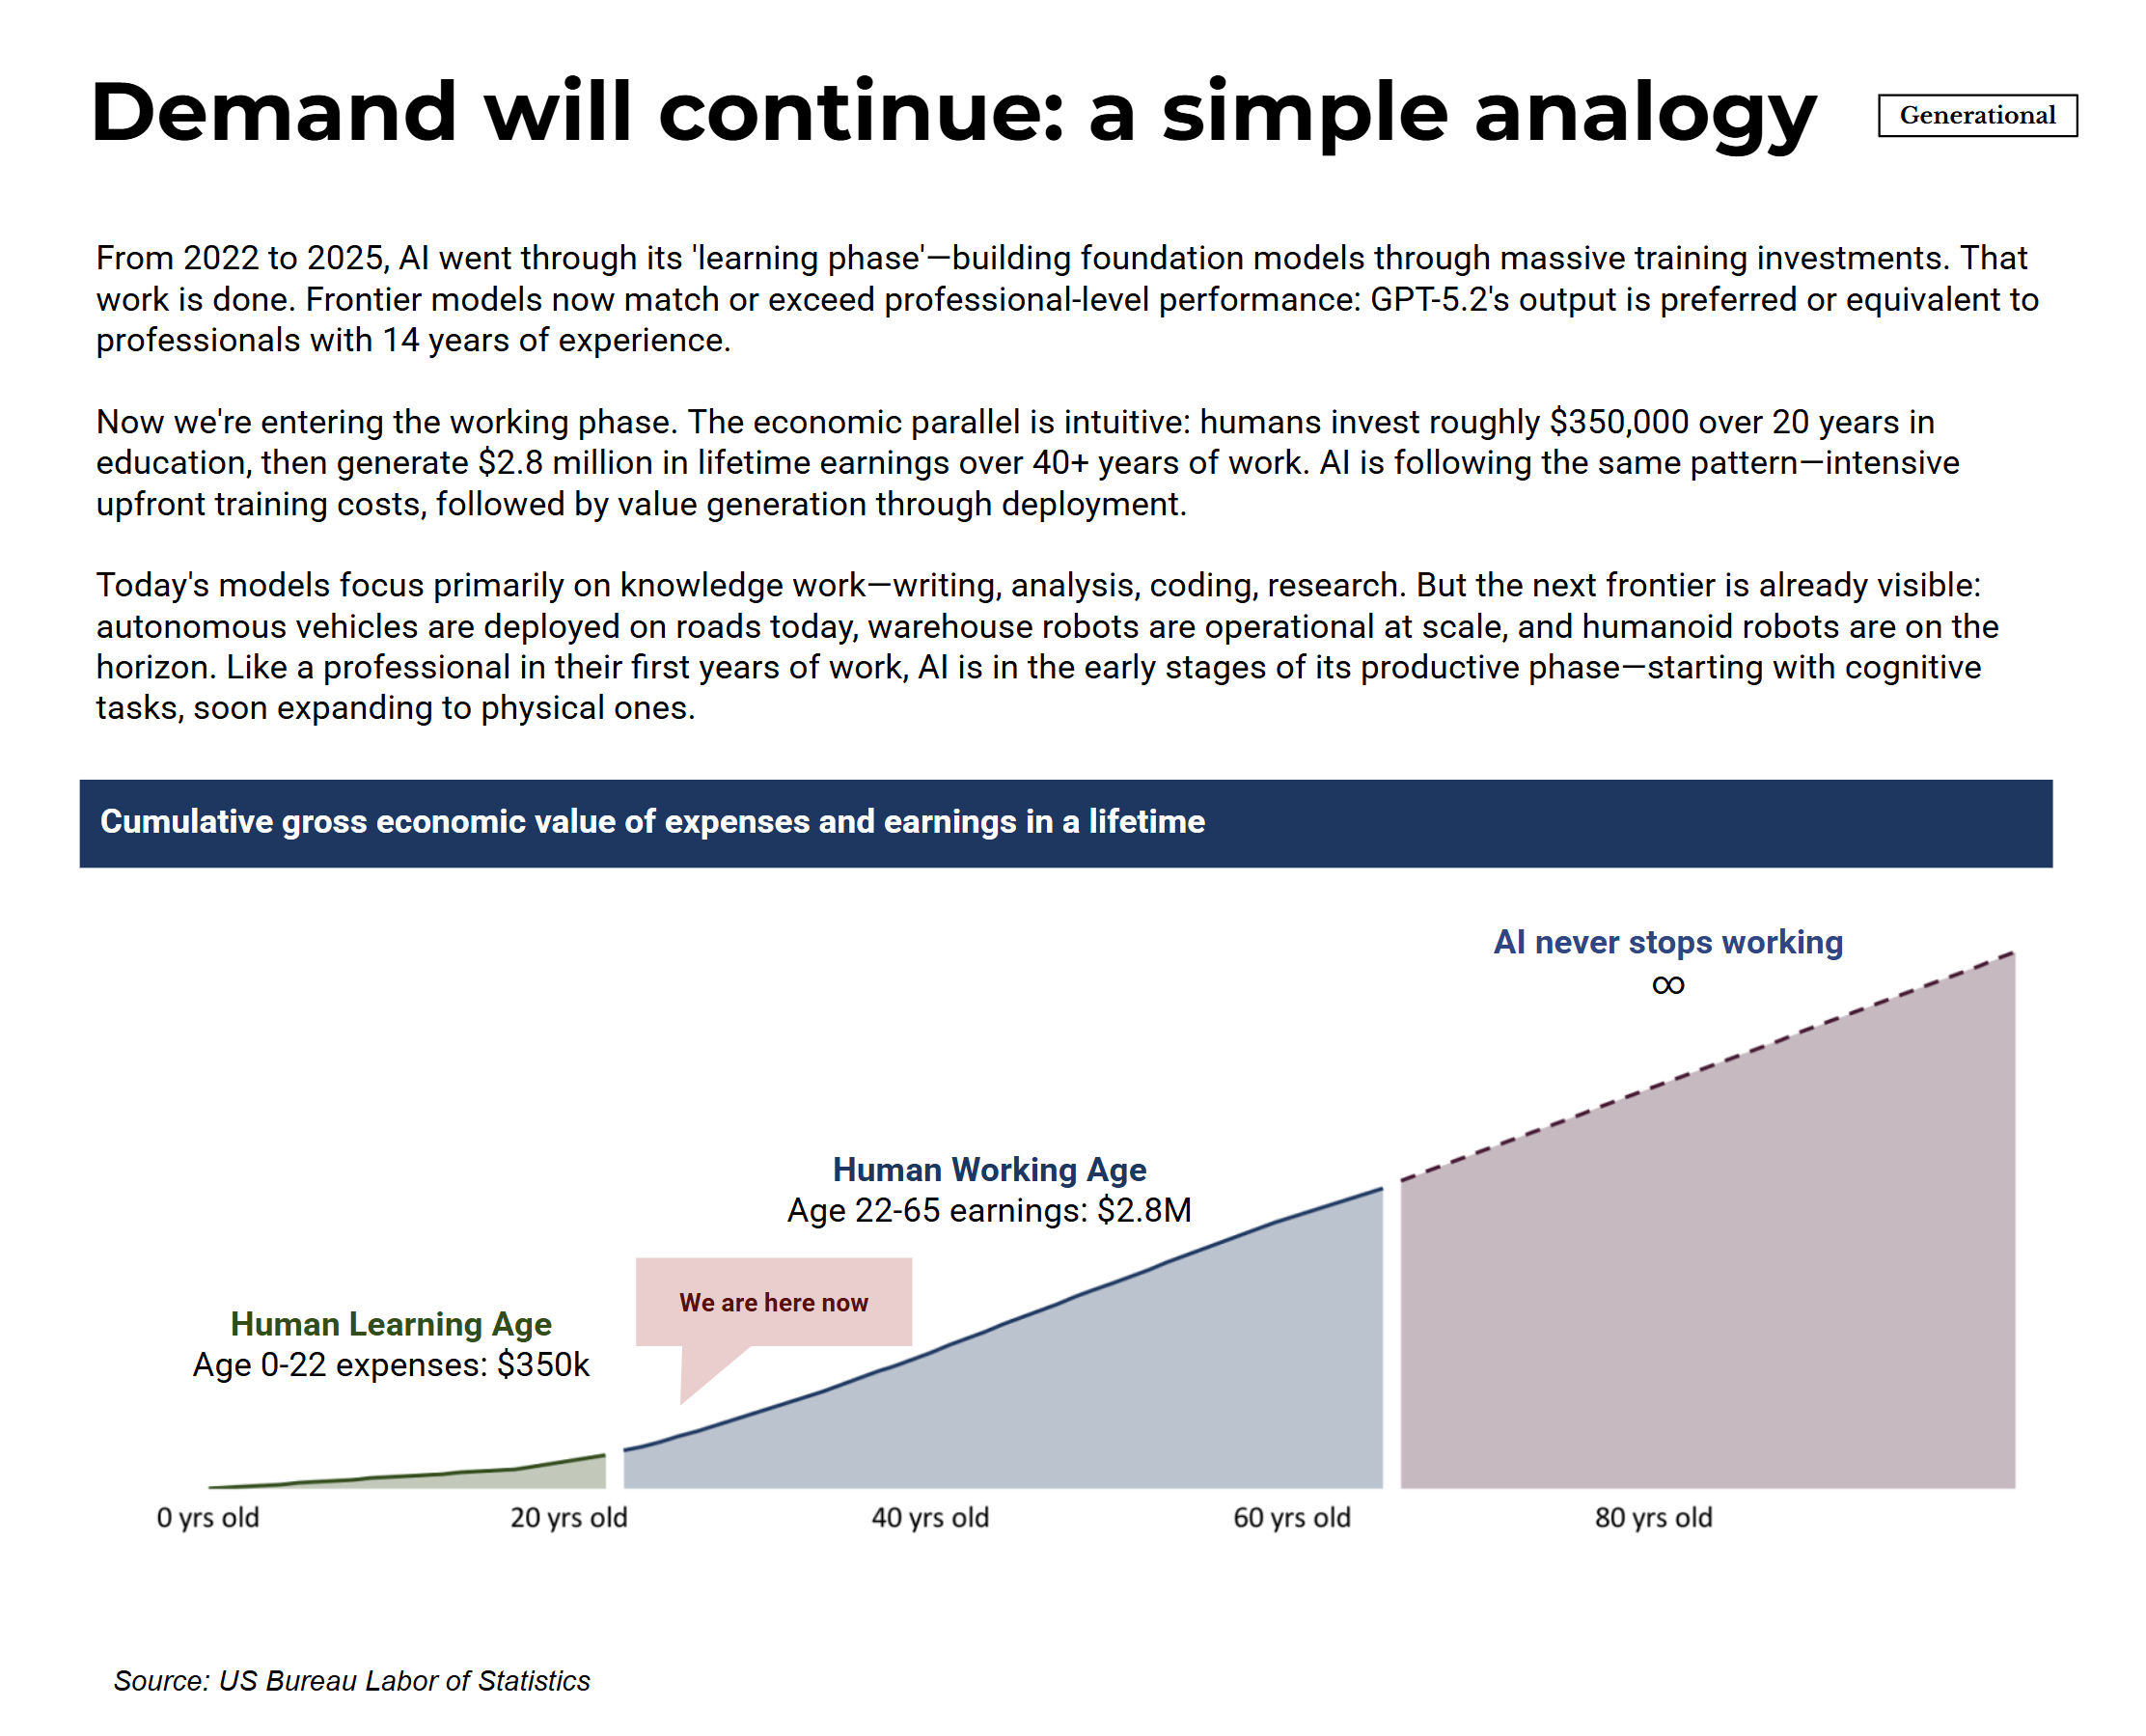
One way to contextualize where AI sits developmentally: think of it like human capital formation. Humans absorb roughly $350,000 in rearing and education costs over 20 years, then produce approximately $2.8 million in lifetime earnings over a 40+ year career. AI spent 2022-2025 in its equivalent “education phase”—massive investment in training foundation models. We’re now entering the “working phase” where deployment generates returns. The important difference: humans retire and their knowledge doesn’t transfer perfectly. AI systems can operate indefinitely and improve continuously.
This framing helps explain why the traditional bubble indicators aren’t flashing red. Economists look at five macro signals that preceded the dot-com crash: extreme valuations, declining corporate profits, elevated credit risk, high cash burn, and rising leverage. These tend to move in sequence—valuations run hot first, then fundamentals deteriorate, then credit markets crack.
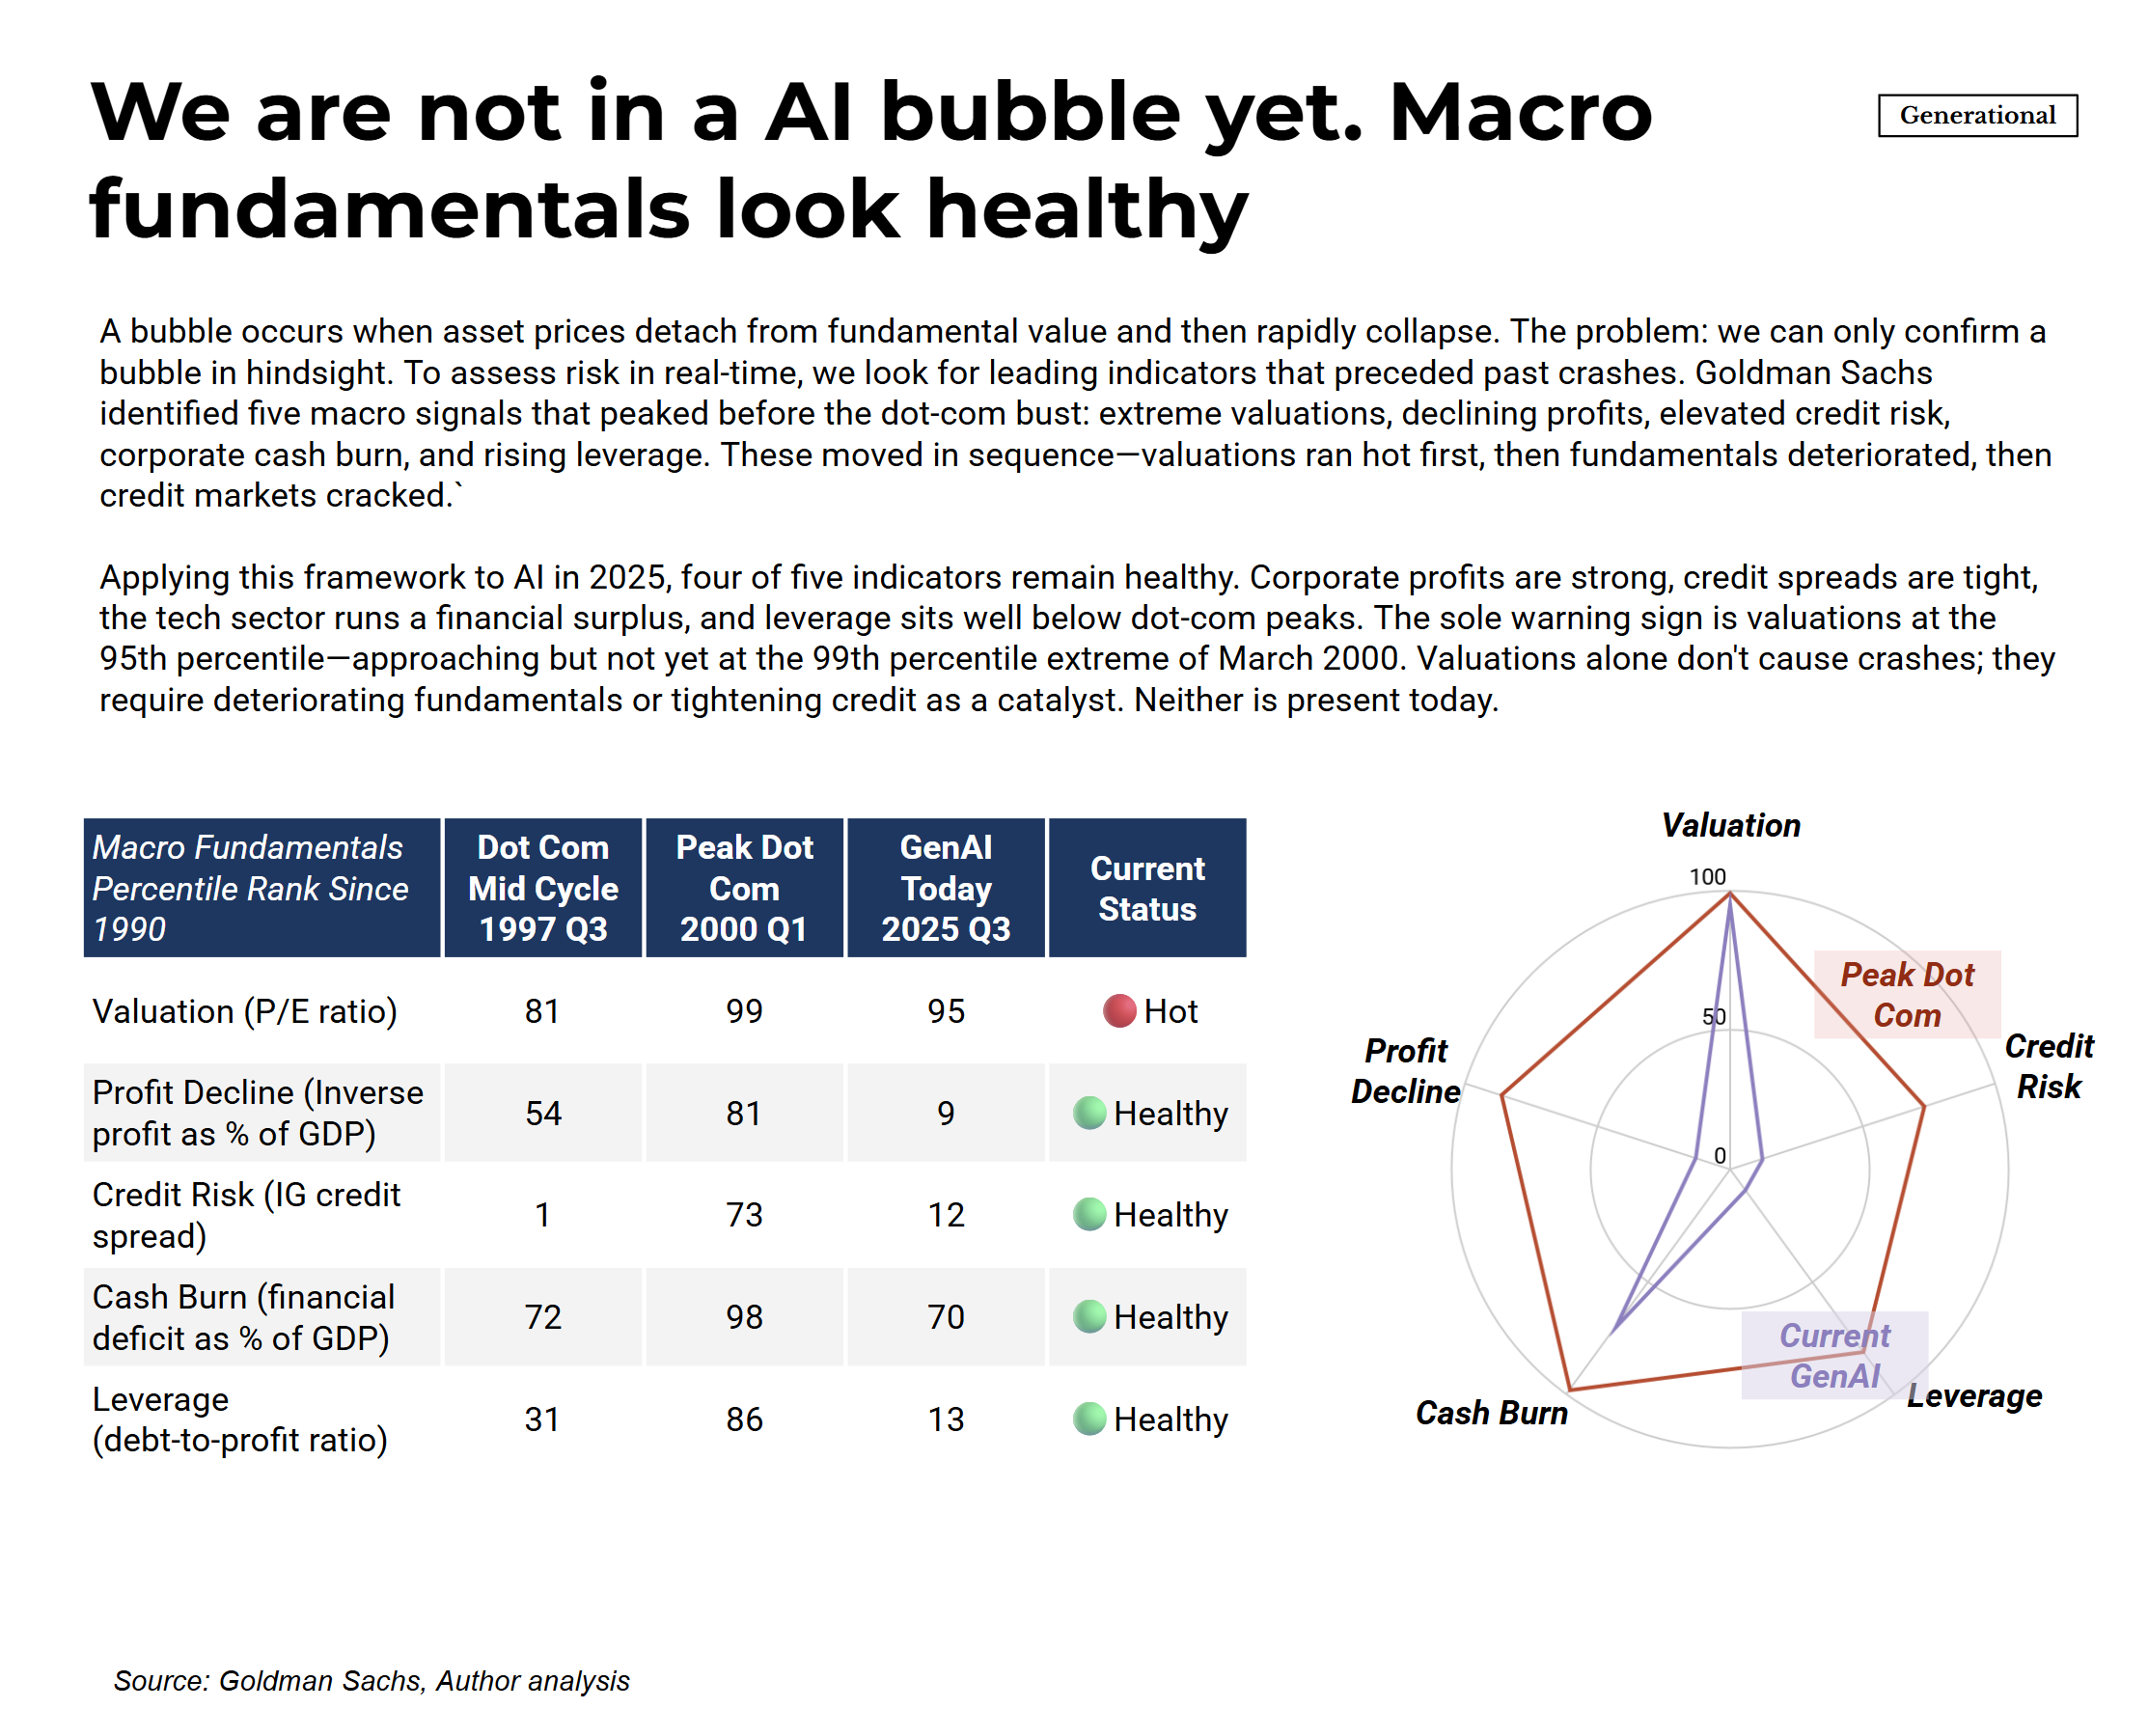
The current picture shows valuations elevated but not extreme (95th percentile vs. the 99th percentile at the March 2000 peak), with the other four indicators in healthy territory. This is what you’d expect if demand is real rather than speculative: companies can support elevated valuations because underlying profits are strong, not because everyone is buying in anticipation of selling to a greater fool.
The demand side of the AI market doesn’t look like a bubble. It looks like a genuine technological transition with measurable economic impact.
Supply: What’s Being Built
Meeting this demand requires building across the entire AI value chain—from semiconductor fabrication through data center infrastructure to the software layers that deliver AI to end users.
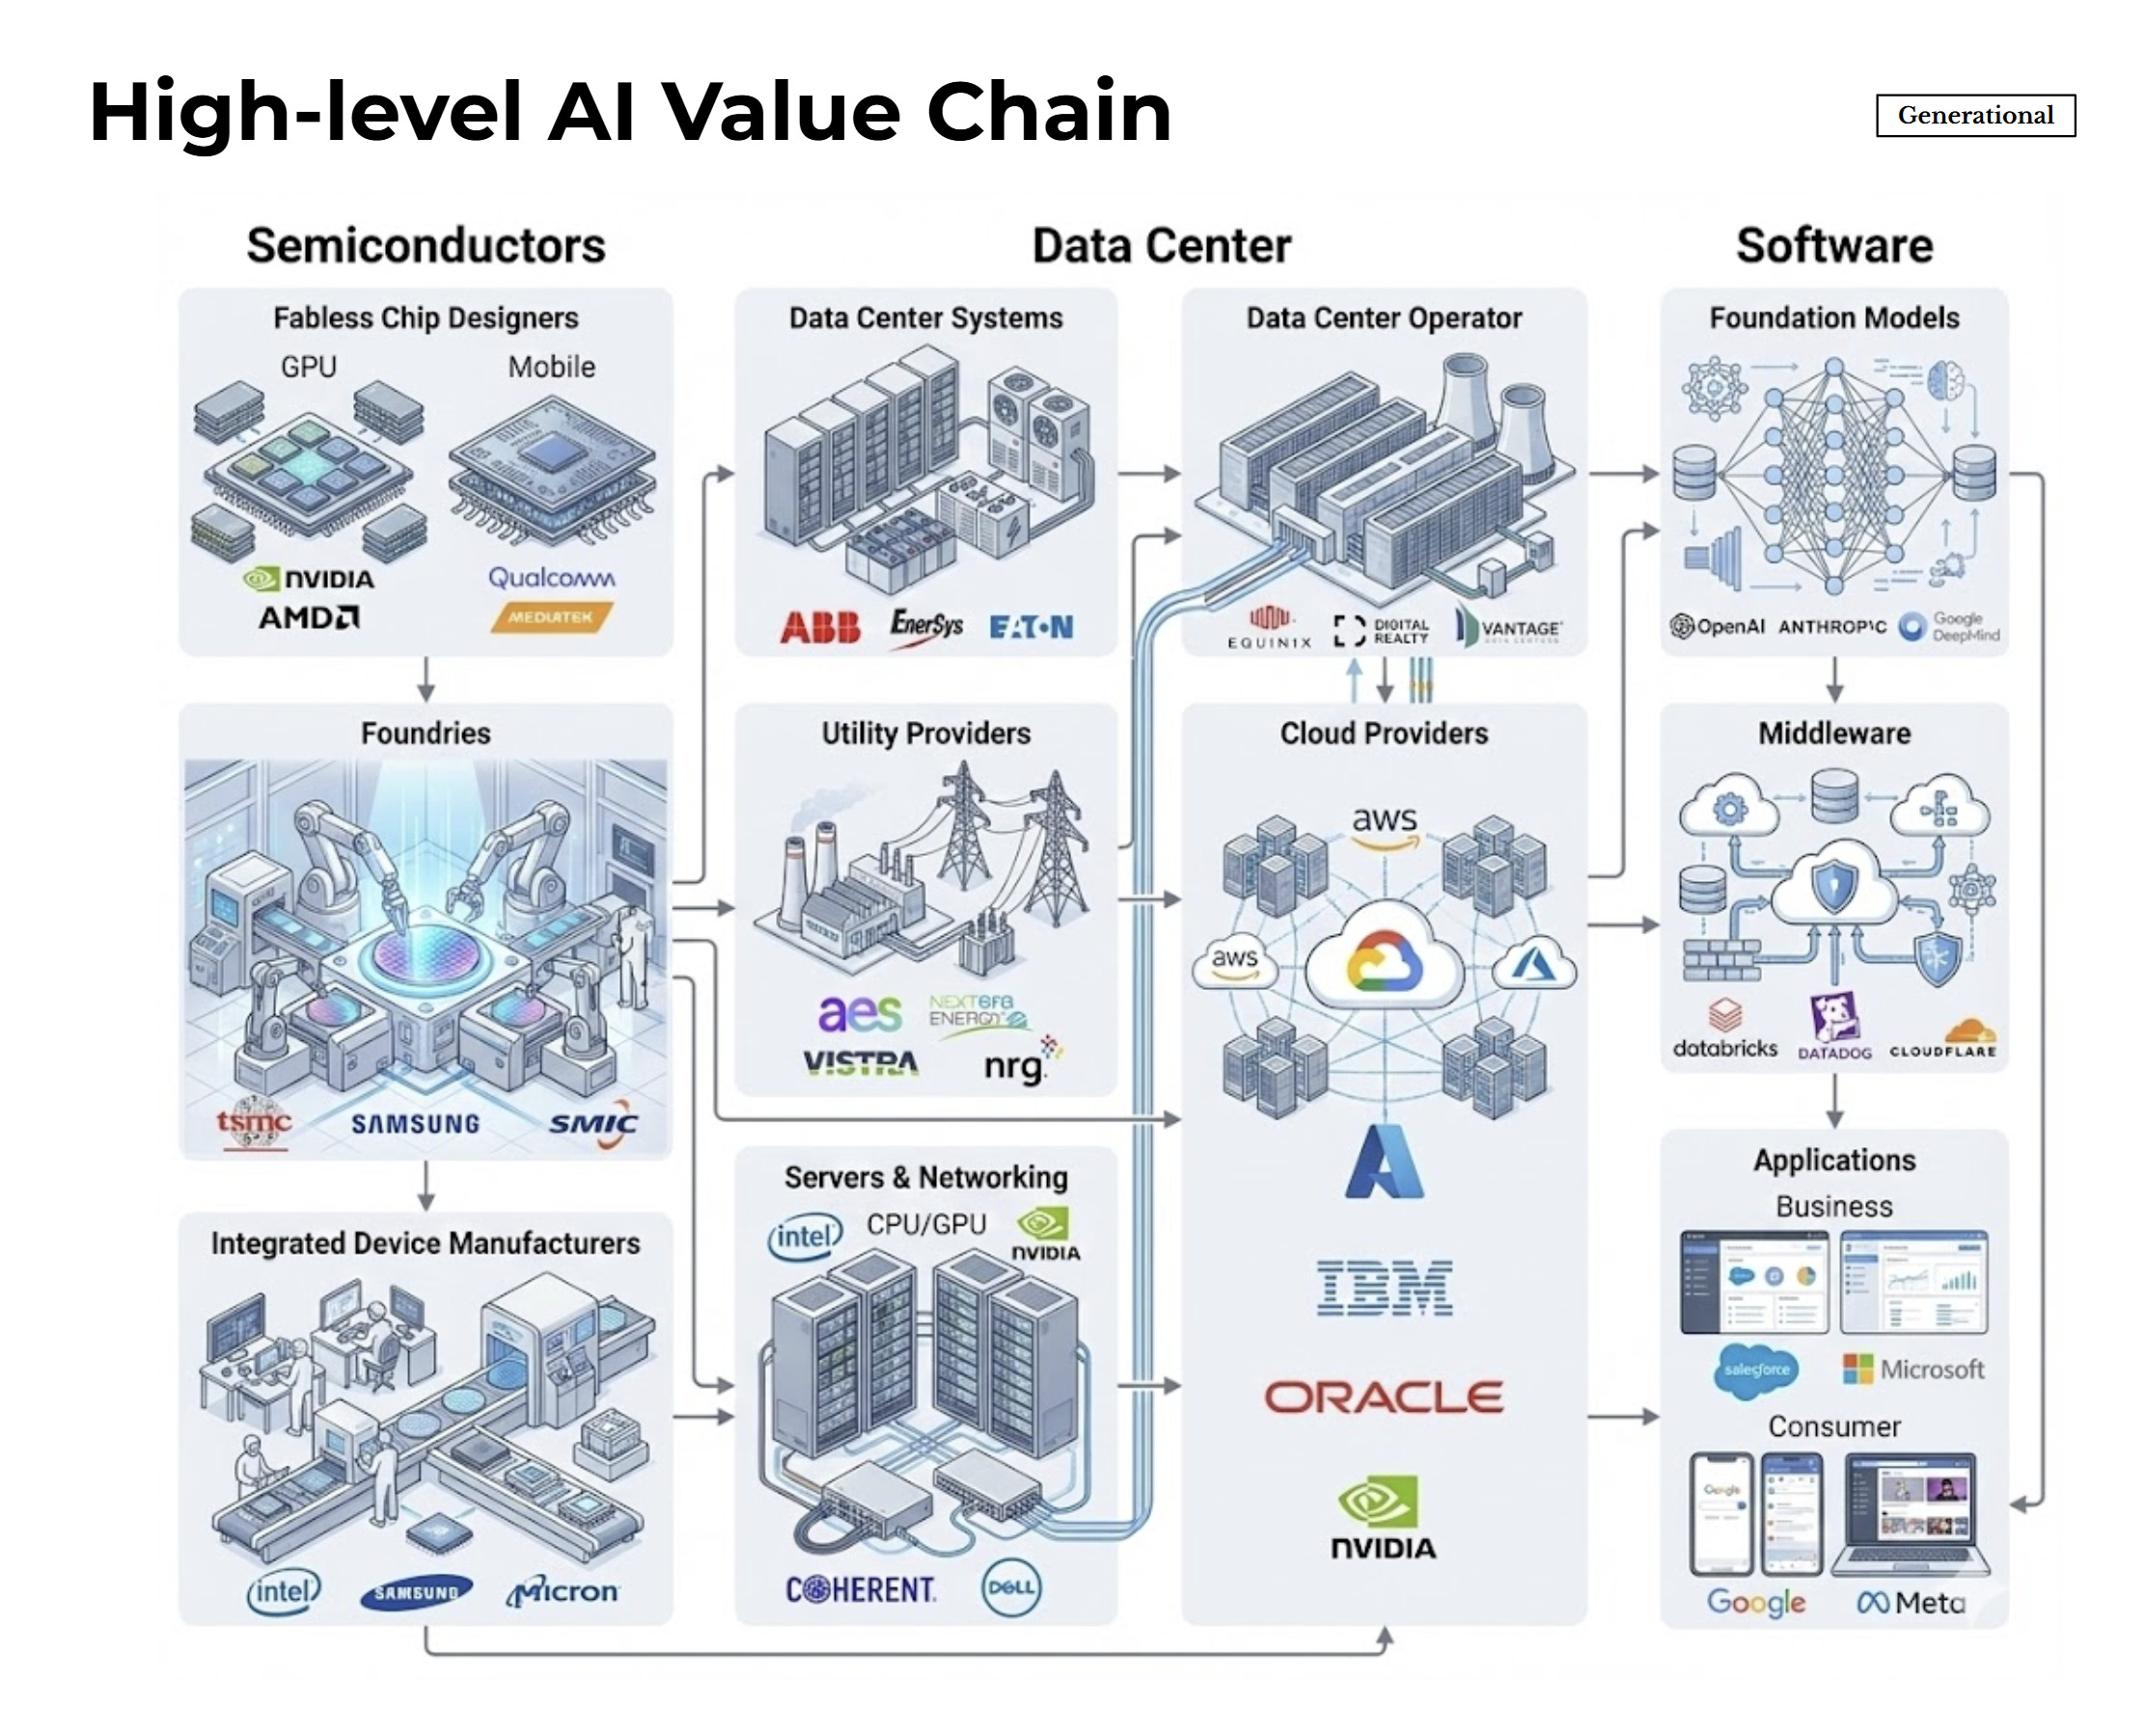
The chain spans multiple industries with different economics. Semiconductor fabrication is concentrated (TSMC, Samsung) and capital-intensive. Data center buildout requires coordinating power systems, servers, networking, and physical facilities. Cloud providers and operators sit in between, purchasing compute capacity and selling it to software companies and enterprises. Each layer depends on the others. Constraints anywhere ripple through the system.
The buildout currently faces real bottlenecks. In a survey of 149 senior data center professionals, 92% cited utility capacity as a barrier, with 44% facing 4+ year wait times for grid connections. Permitting issues affect 86%, fiber availability 85%, chip access 81%.
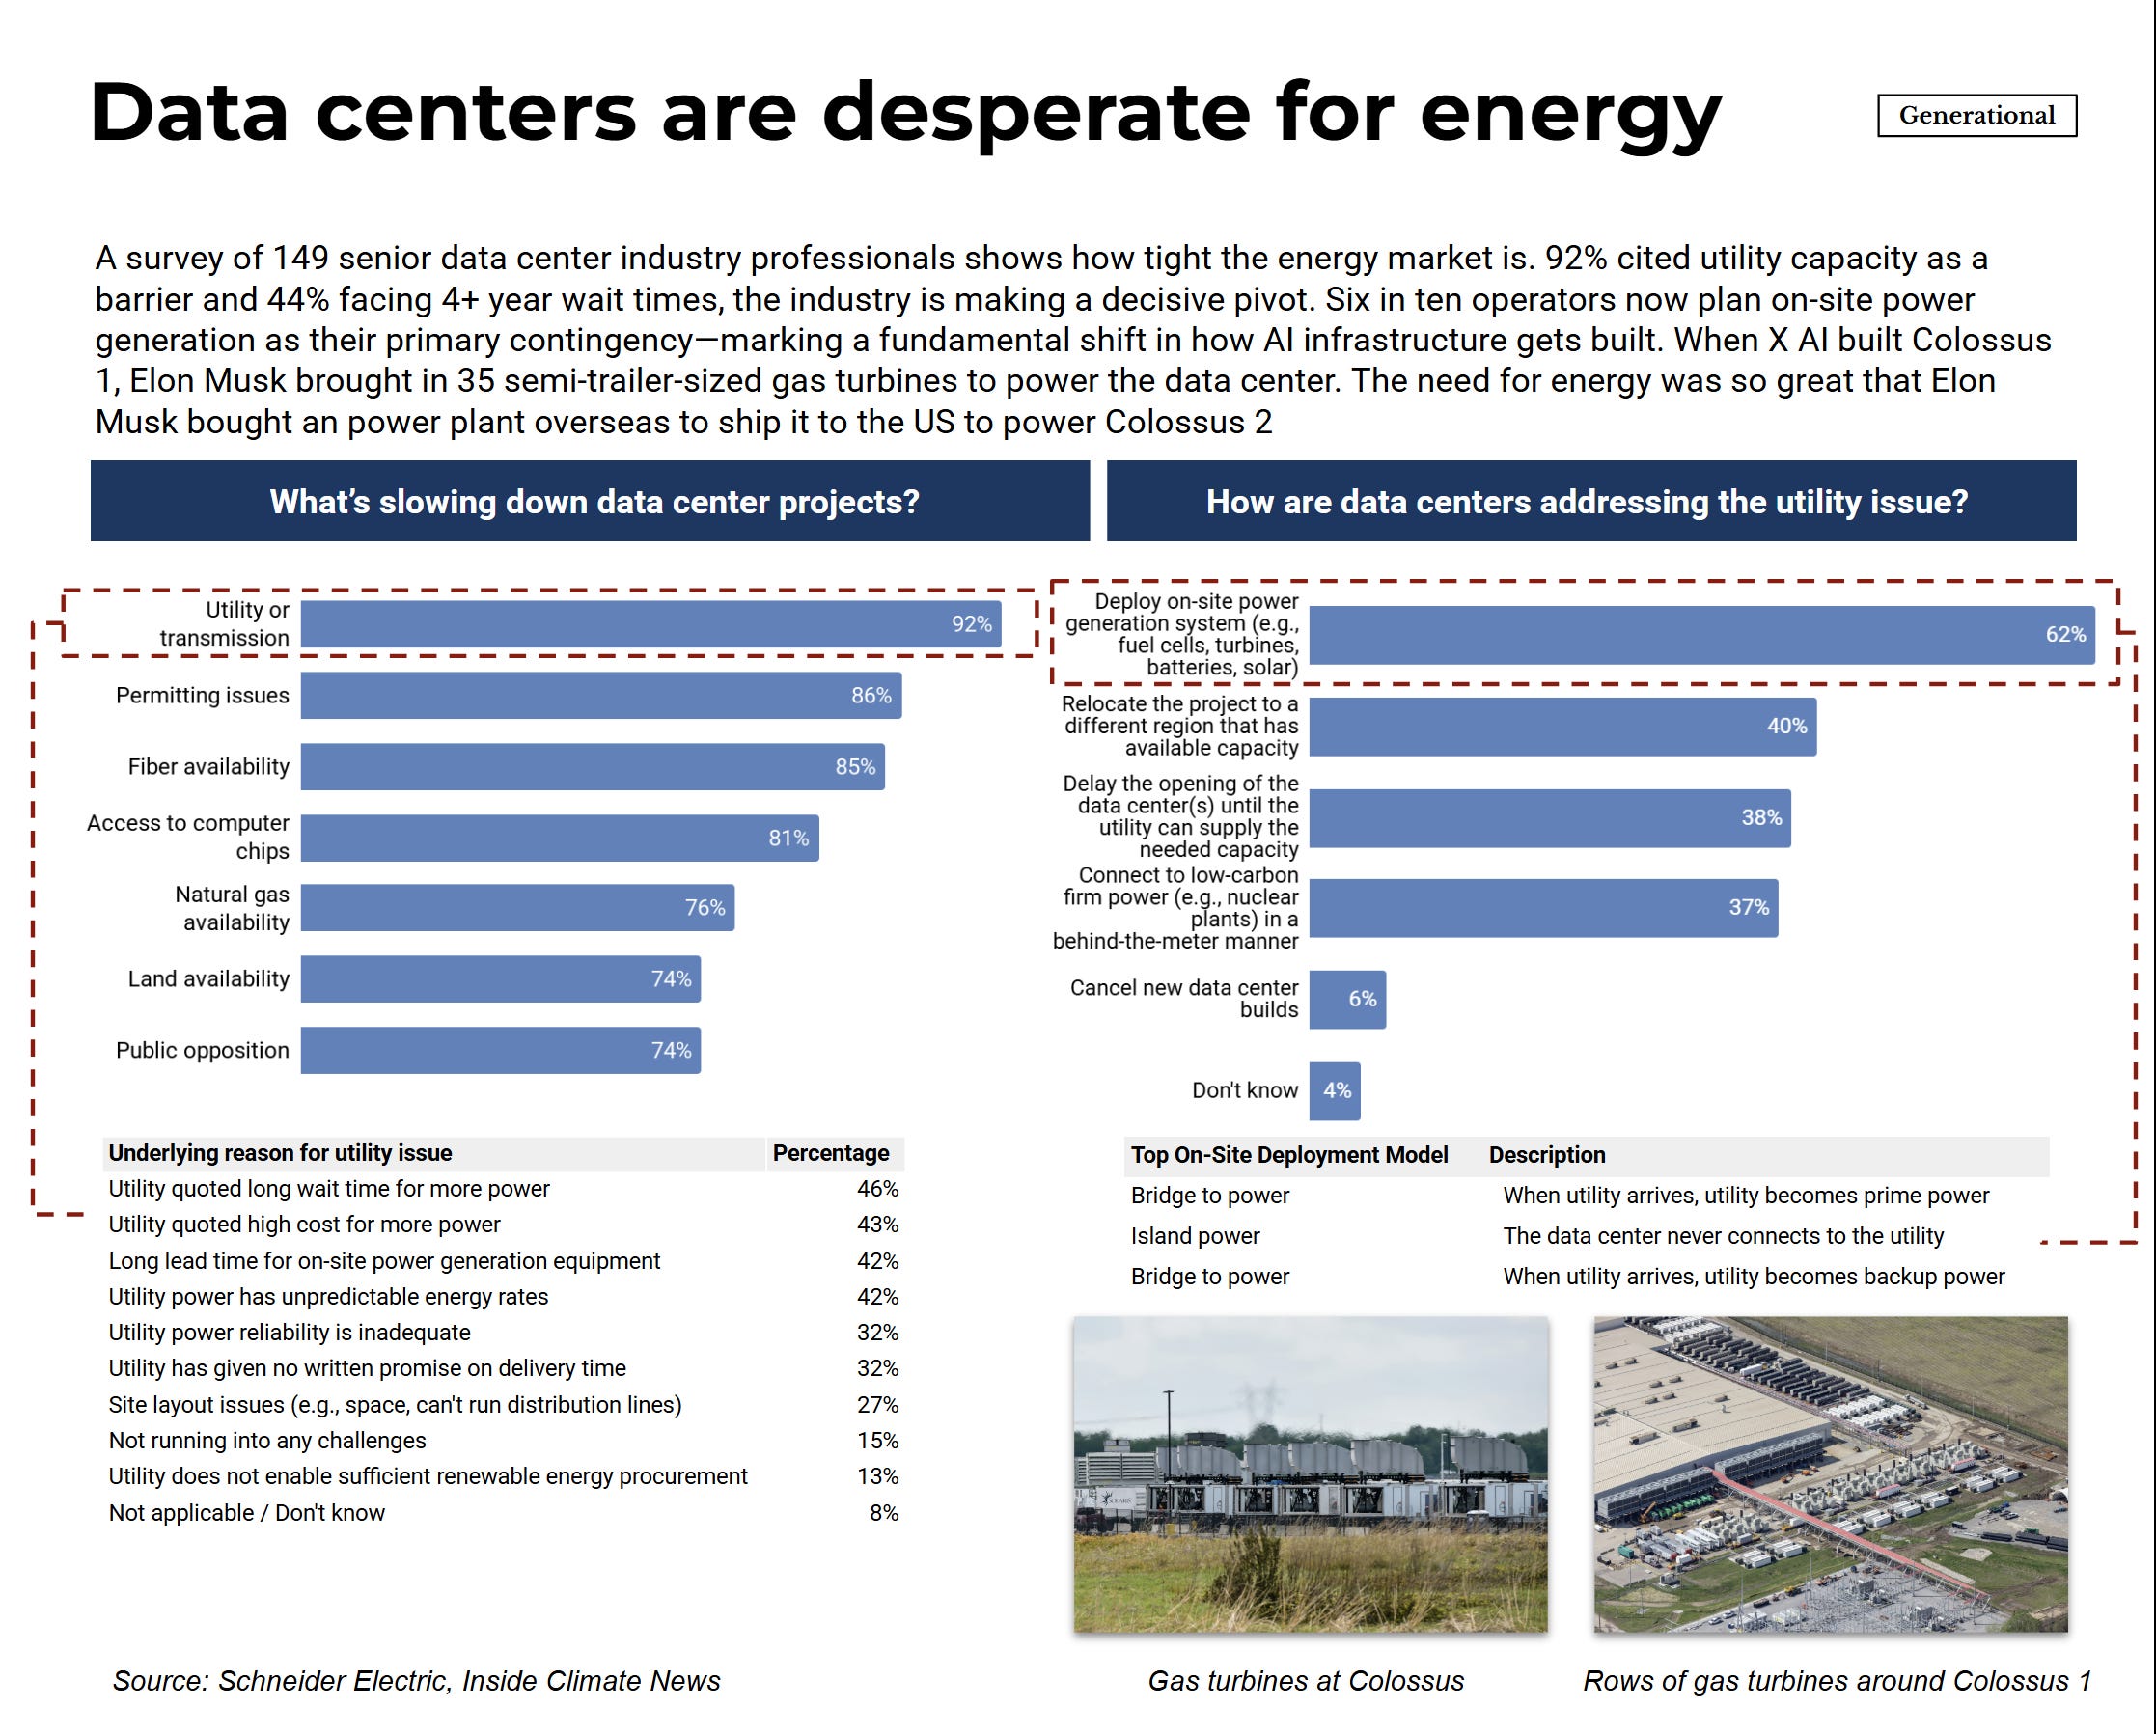
The industry response has been to route around constraints rather than wait for them to clear. 62% now plan on-site power generation as primary contingency—a shift from treating utilities as default to treating them as backup. When Elon Musk built Colossus 1, he brought in 35 semi-trailer-sized gas turbines. For Colossus 2, he bought a power plant overseas, disassembled it, and shipped it to the US for reassembly. These reflect how tight the energy market has become.
These constraints explain why shortage pricing exists today. The question for financing is whether they persist long enough to support the debt structures being built around them.
Supply: The Financing Structure
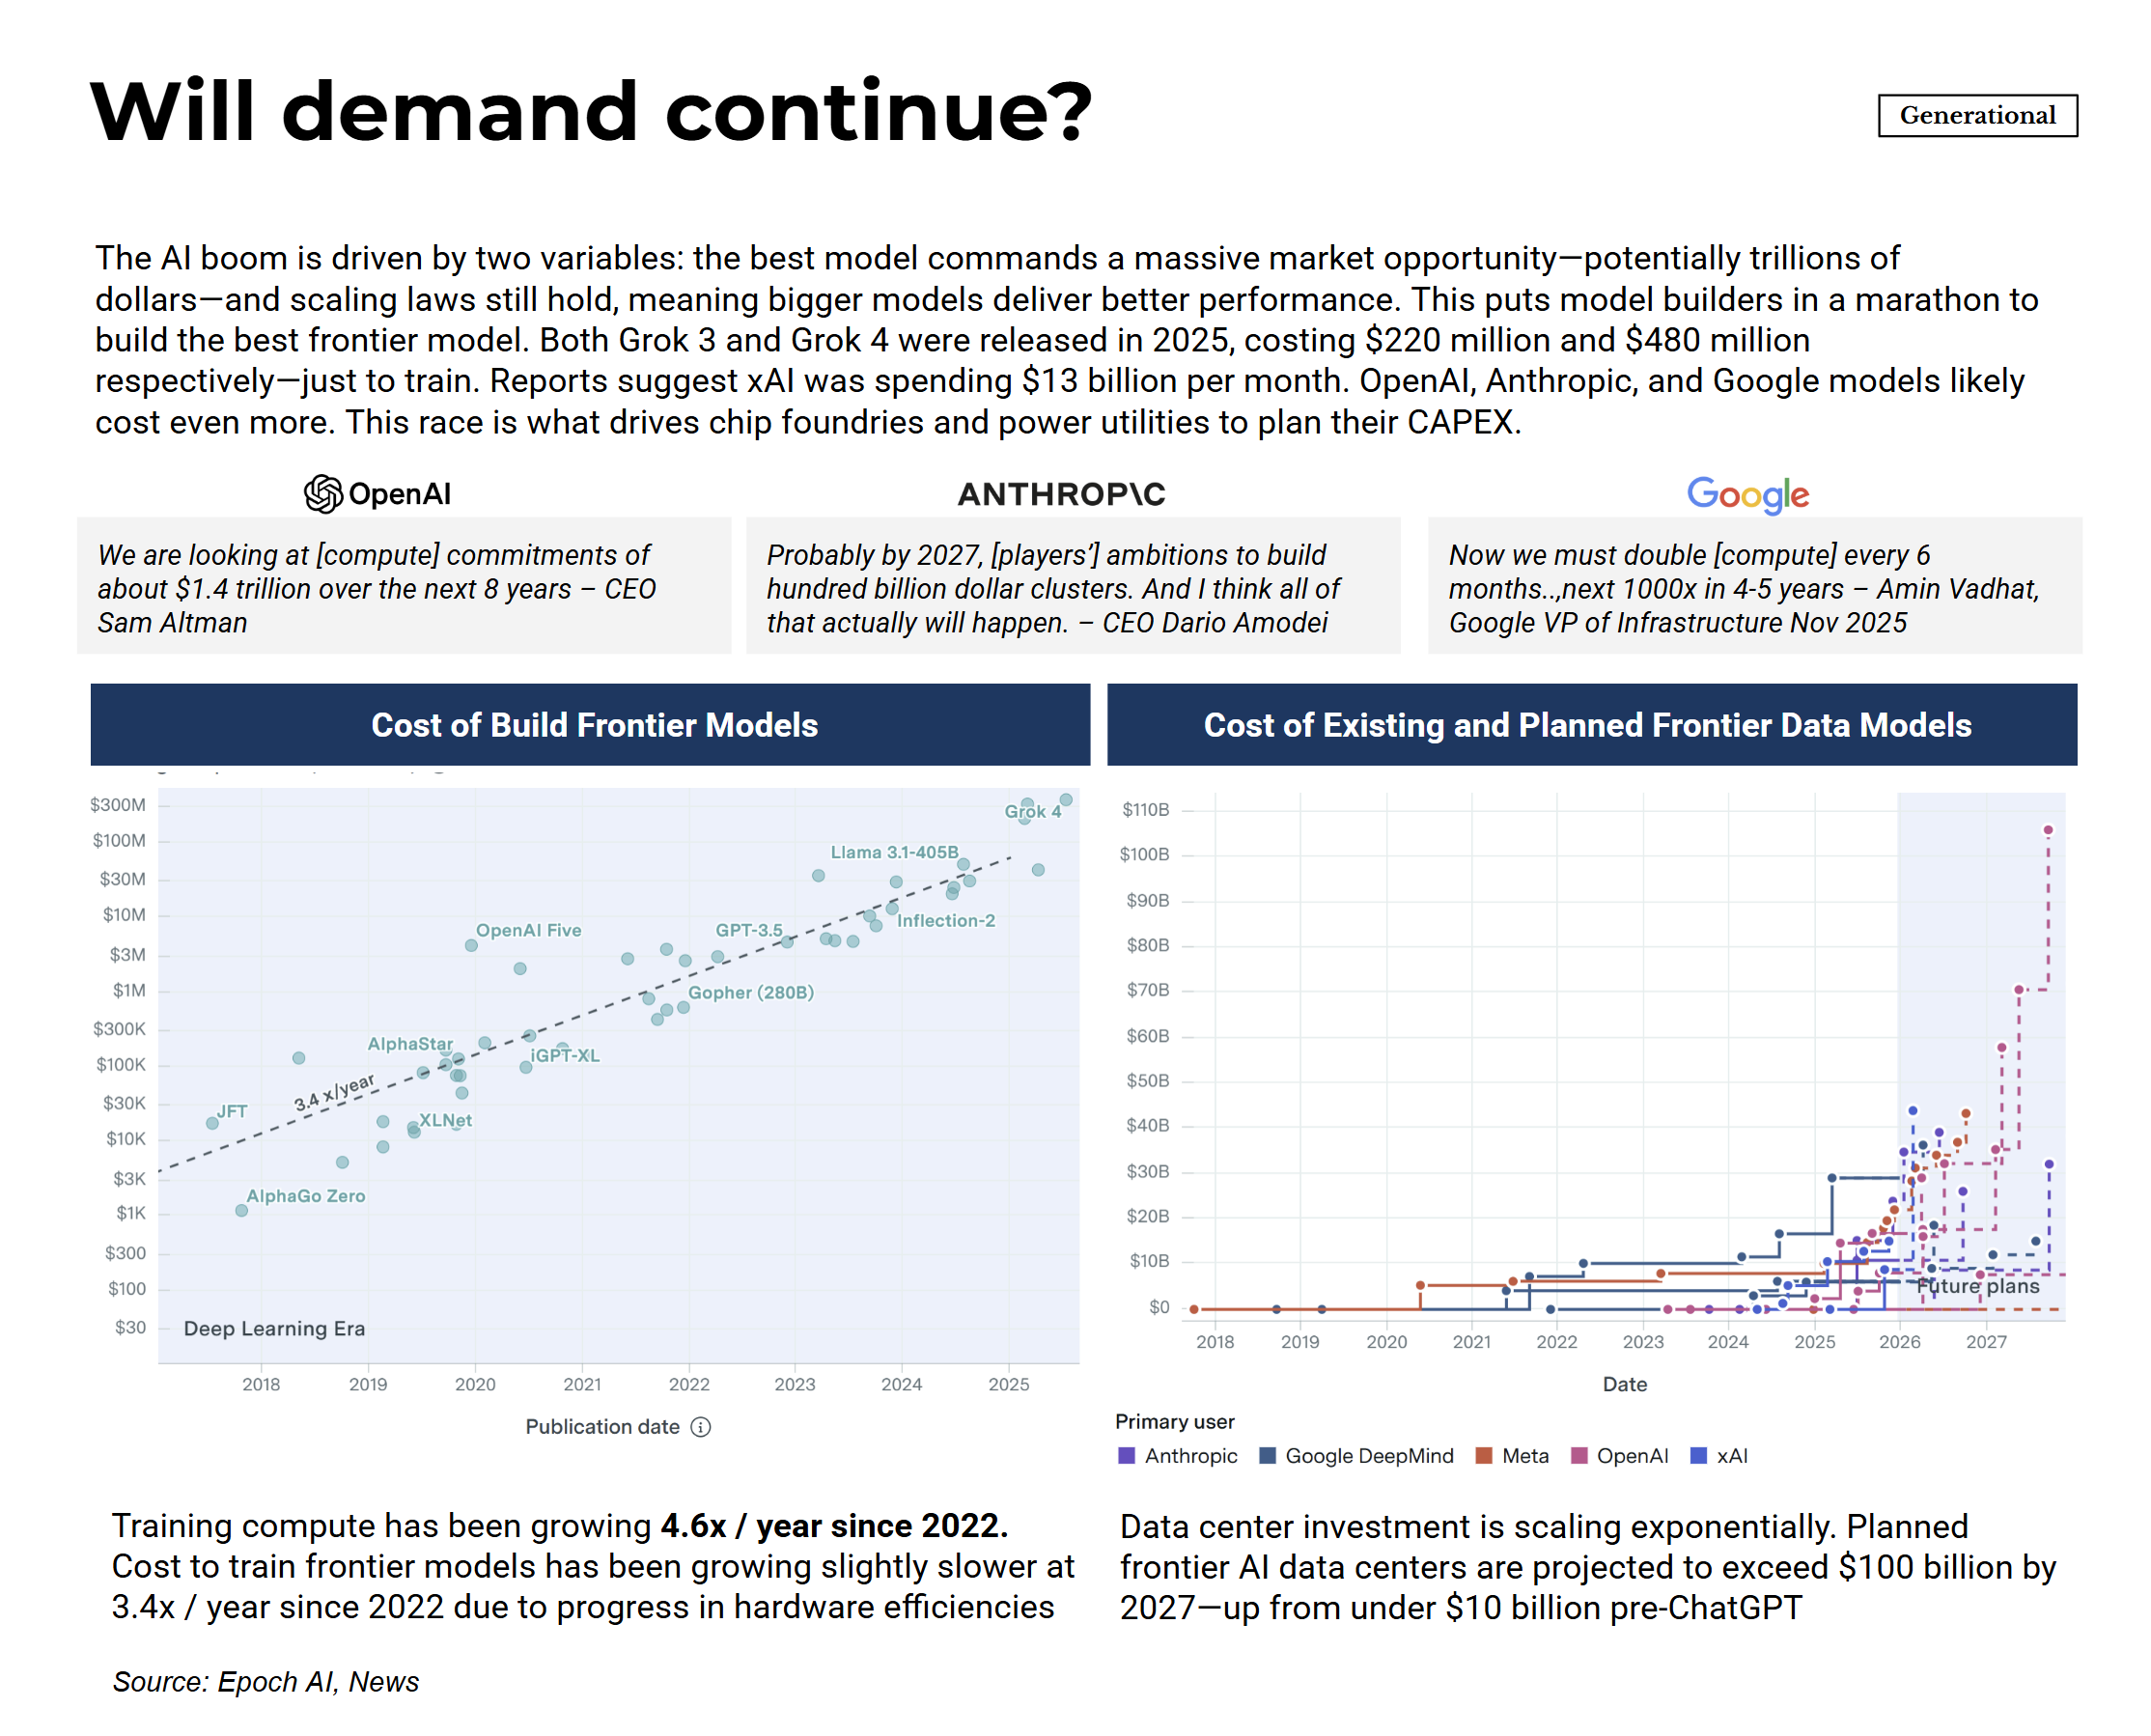
The AI buildout requires approximately $2.9 trillion in data center capital expenditure through 2028. The hyperscalers are spending aggressively and so is OpenAI. CEO Sam Altman references $1.4 trillion in compute commitments over eight years. Dario Amodei describes ambitions for hundred-billion-dollar training clusters. Google’s infrastructure leadership talks about doubling compute every six months.
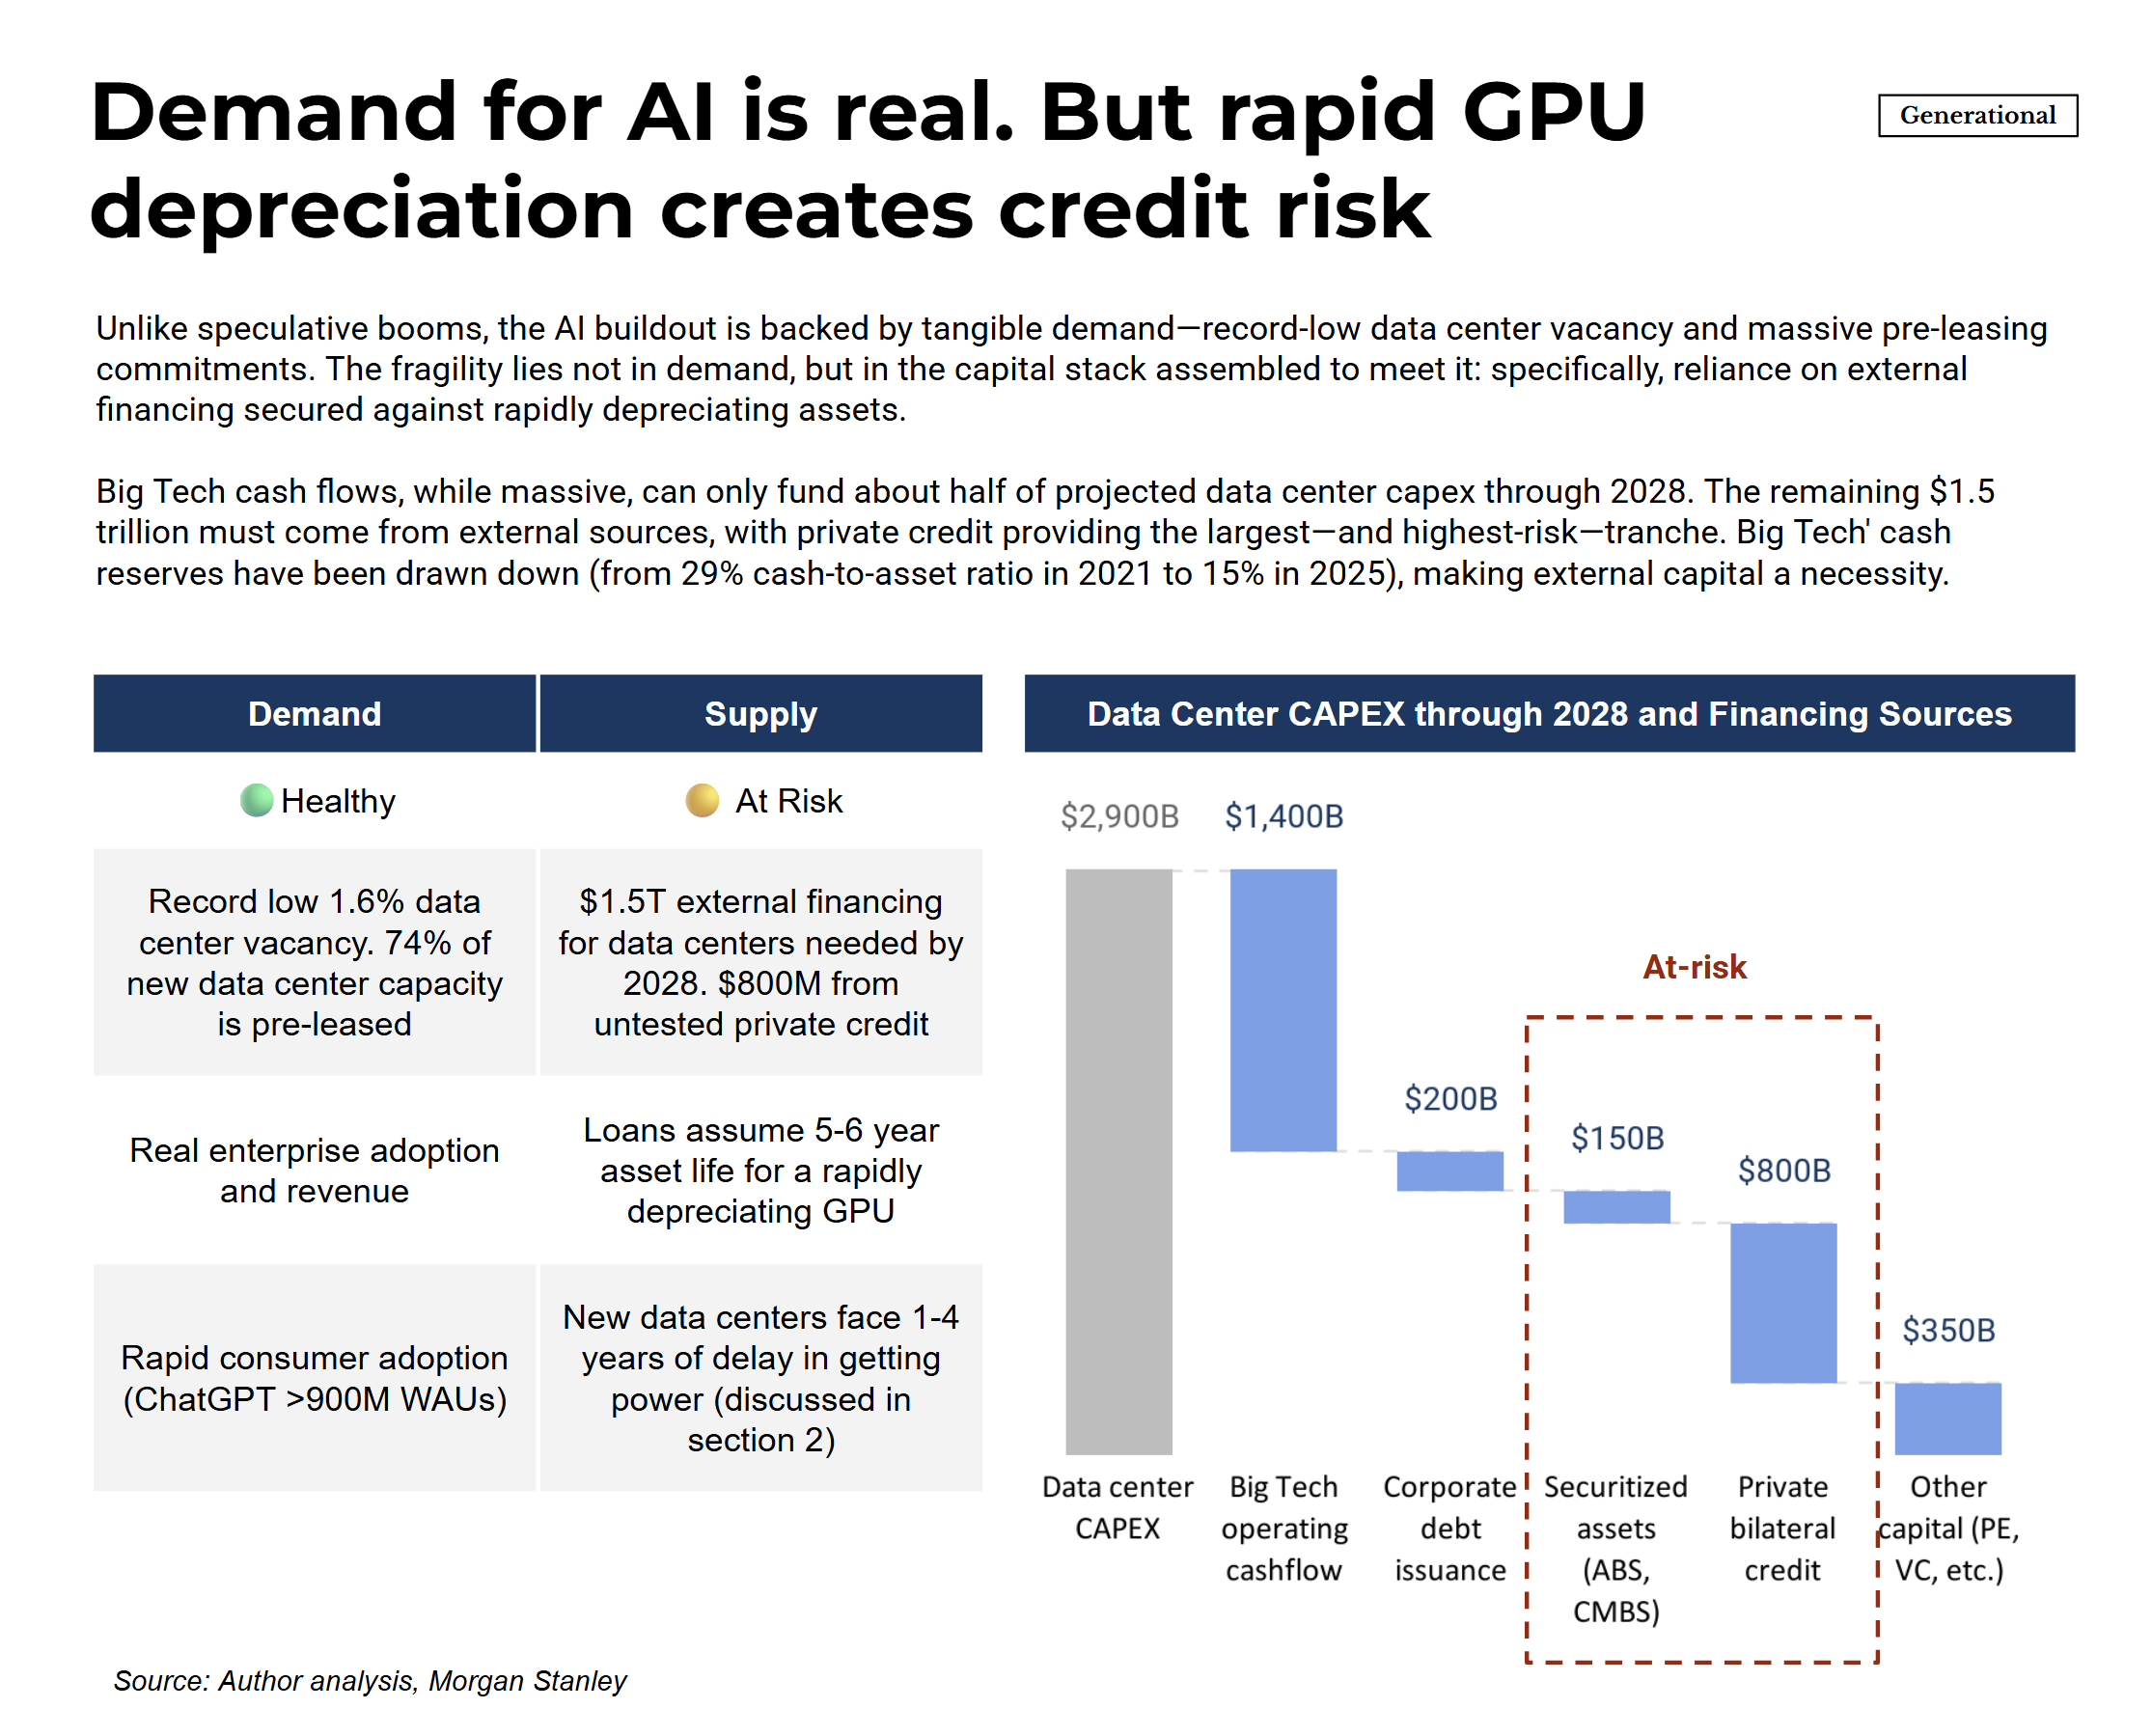
Hyperscalers’ operating cash flows can fund roughly half of this. The remainder—about $1.5 trillion—requires external capital. This isn’t unusual. Large infrastructure buildouts routinely rely on outside financing. What matters is whether that financing is structured appropriately for the assets it’s funding.
The capital stack breaks down as follows: $200 billion from corporate debt issuance (companies borrowing against their own balance sheets), $150 billion from securitized assets (loans packaged and sold to investors), $800 billion from private bilateral credit (direct loans from non-bank lenders), and $350 billion from other sources including private equity.
The $150 billion in securitized assets and $800 billion in private credit deserve particular attention because of their scale and characteristics. Private credit consists of loans extended by asset managers, pension funds, and specialty lenders rather than traditional banks. Private credit has grown dramatically over the past decade, partly because post-2008 banking regulations pushed riskier lending outside the regulated system. The loans are typically held to maturity rather than traded, which means problems don’t surface until borrowers actually struggle to pay. Securitized assets carry a different risk: loans packaged and sold to dispersed investors who may not fully understand the underlying collateral dynamics—a structure that should sound familiar from 2008.
The nearly $1 trillion in external debt expected to finance data centers through 2028 carries a specific assumption: that the underlying assets—primarily GPUs and related infrastructure—will retain enough value over a 5-6 year loan term to support the debt. This assumption is standard for infrastructure lending, where assets like buildings, fiber optic cables, or aircraft depreciate slowly and predictably over decades.
GPUs don’t work that way.
The Depreciation Problem
When lenders finance infrastructure, they model whether cash flows provide enough buffer to service the debt. In a worst-case default scenario, they assess how much they can recover by liquidating the assets. Ideally, loan-to-asset value stays below 100% so lenders can recoup their principal.
For most infrastructure, this is straightforward. Commercial buildings depreciate over 30-40 years. Fiber optic cable lasts 25-30 years and, because improvements happen in endpoint equipment rather than the cable itself, the same physical glass can carry more data over time as technology advances. Aircraft operate for 20-25 years. These timelines give lenders comfortable cushion against typical 5-year loan terms.
GPUs follow a different pattern. NVIDIA releases a new architecture roughly every 12-18 months, and each generation delivers 2-4x better performance per watt than its predecessor. Unlike fiber, where new technology makes existing infrastructure more valuable, new GPU technology makes existing chips obsolete. Operators must replace the GPUs themselves.
The practical result: GPUs have competitive lives of 2-4 years before they’re outperformed enough to lose pricing power. An H200 purchased today will compete against B200 chips delivering twice the performance. Within 2-3 years, it will face Rubin delivering nearly 9x the compute—an efficiency gap that makes older hardware economically uncompetitive.
This matters for financing because the loans assume 5-year asset lives while the assets themselves become economically obsolete in 2-4 years. The only way the math works is if shortage pricing persists—if demand so exceeds supply that even older GPUs command premium prices throughout the loan term.
How the Financing Breaks
To see where the stress point lies, consider the economics of a GPU-based data center at different pricing scenarios.
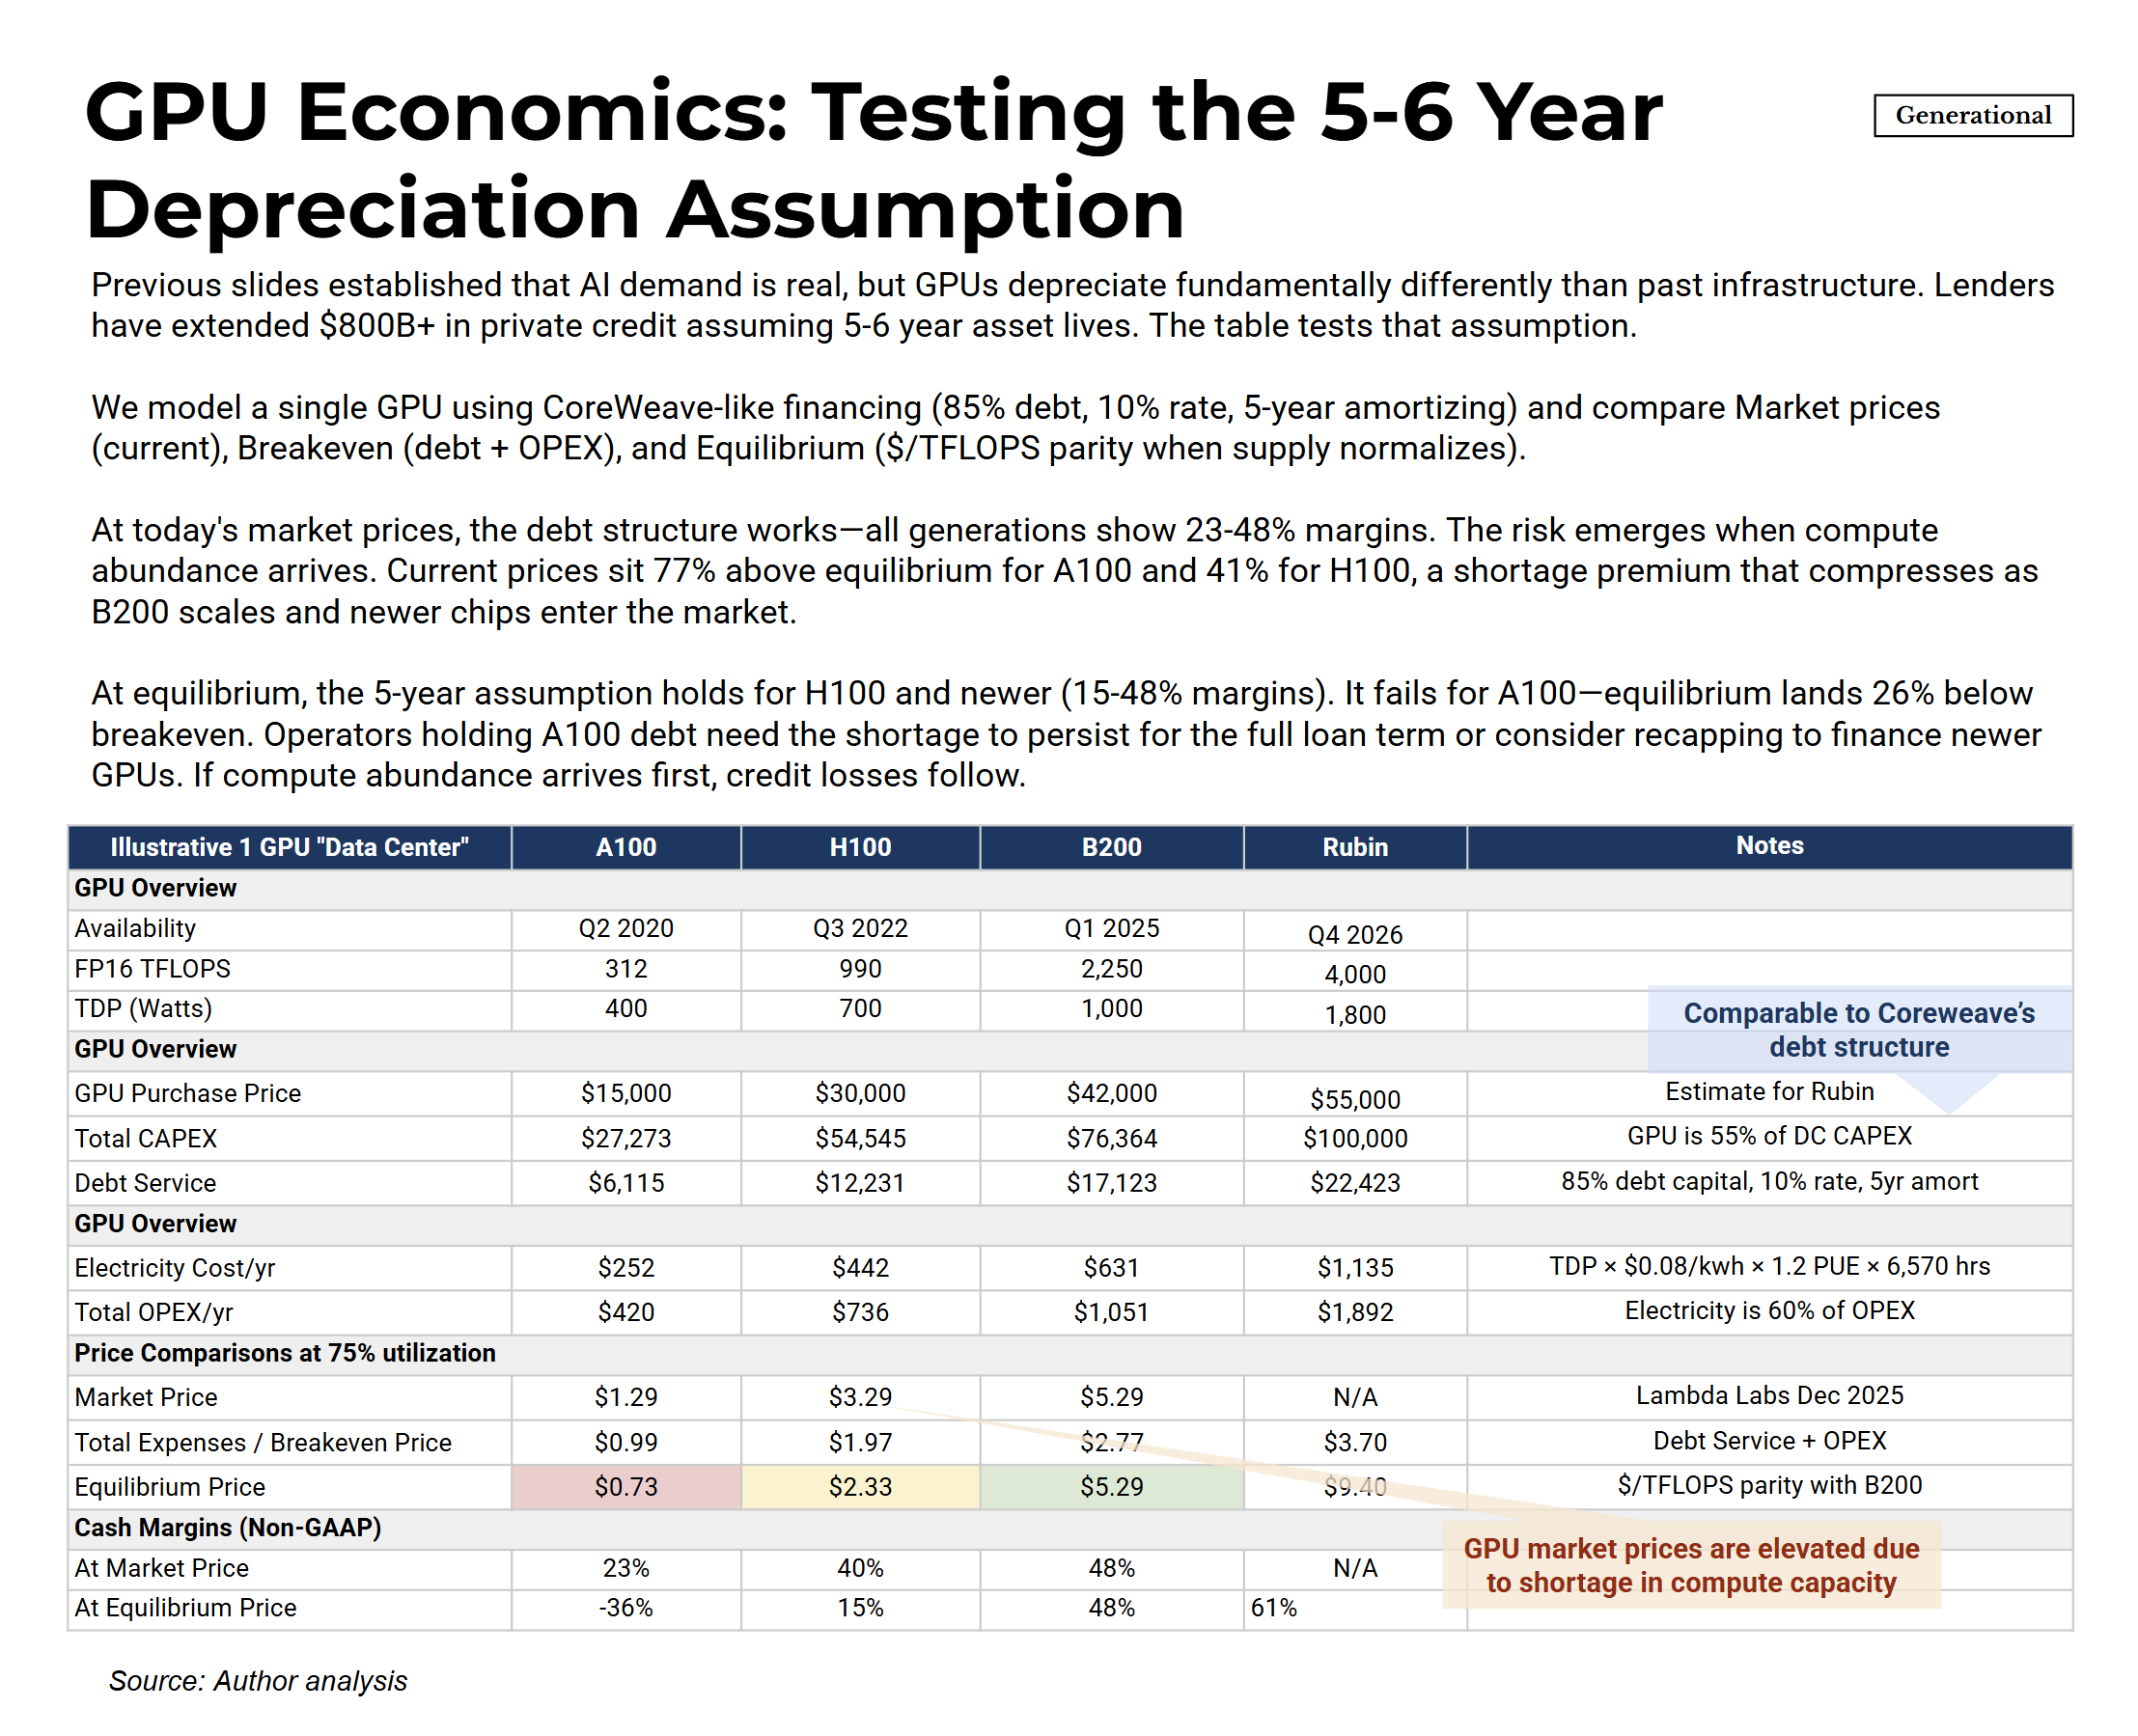
The table models a single-GPU data center using a financing structure similar to CoreWeave’s: 85% debt, 10% interest rate, 5-year amortization. Three price points matter:
Market price is what operators currently charge customers for compute, set by supply and demand in today’s constrained environment.
Breakeven price is the minimum rate needed to cover debt service plus operating expenses (primarily electricity). Below this, the operator loses money and defaults on debt.
Equilibrium price is what pricing would look like if supply caught up with demand and GPUs competed purely on performance per dollar. At equilibrium, older chips must price at parity with newer chips on a $/TFLOPS basis, which means steep discounts to their original cost.
At today’s market prices, all GPU generations show healthy margins. This shortage premium is what makes the leveraged financing structure work.
At equilibrium pricing, the picture fractures. H200s and newer chips still cover their costs. But A100s fall deep into negative margins—well below breakeven. Operators holding A100 debt would be unable to service their loans from operating income.
The key question is how long shortage pricing persists. Risky loans in the private credit and securitized asset stack is a bet that equilibrium arrives after the debt matures. If equilibrium arrives earlier, operators face a choice between default and refinancing at unfavorable terms—and refinancing requires finding new lenders willing to take the same bet on even older equipment or invest more money to purchase the latest GPUs.
NVIDIA’s excellence is, paradoxically, the problem. The company’s relentless execution—B200 ramping now, Rubin shipping in late 2026, Rubin Ultra in 2027—means product cycles have compressed to roughly 18 months for a new generation. Each generation delivers dramatic efficiency improvements. NVIDIA’s engineering prowess might be driving the obsolescence cycle faster than lenders modeled.
The hyperscalers themselves are starting to acknowledge this. In January 2025, Amazon reversed course—shortening server depreciation from six years back to five. The company’s 10-K was explicit about why:
In 2024, we also determined, primarily in the fourth quarter, to retire early certain of our servers and networking equipment. We recorded approximately $920 million of accelerated depreciation and related charges for the quarter ended December 31, 2024 related to these decisions. The accelerated depreciation will continue into 2025 and decrease operating income by approximately $0.6 billion in 2025. These two changes above are due to an increased pace of technology development, particularly in the area of artificial intelligence and machine learning.
This is notable because it goes against the trend of other hyperscalers: Meta, Alphabet, and Microsoft have extended depreciation schedules from 3 years to 5 to 6 years since 2020, Amazon looked at the same data and moved the opposite direction.
Two Forces Accelerating Supply Equilibrium
Several developments are accelerating the path toward compute equilibrium, each working through a different mechanism but producing the same effect: more compute capacity available per dollar, which erodes shortage pricing.
Algorithmic efficiency is compounding faster than most models assumed. DeepSeek provides the clearest data points. Their V3 model, released December 2024, trained with 2.6 million GPU hours compared to 30.8 million for Meta’s Llama 3 405B—roughly 12x more efficient for comparable benchmark performance. The headline “$5.5 million training cost” is debatable, but the efficiency differential was real and reflected genuine architectural innovations.
By December 2025, their V3.2 release achieved results that benchmark against GPT-5: gold medal performance at the International Mathematical Olympiad, top-10 at the International Olympiad in Informatics, second place at ICPC World Finals (programming). Cost to run the Artificial Analysis benchmark is $54 vs Grok 4’s $1,900—35x cheaper for better results. On January 2, 2026, DeepSeek published a paper introducing “Manifold-Constrained Hyper-Connections,” a training architecture that addresses scaling instability—one of the key obstacles to training ever-larger models efficiently. Expect this technique to appear in their next major release.
The implication for infrastructure financing: efficiency gains reduce compute demand per unit of AI capability. If capability-per-dollar improves 10x annually, the compute needed to serve a given market shrinks proportionally. That’s positive for AI adoption and negative for GPU pricing power. Shortage premiums compress not because demand falls, but because less supply is needed to meet it.
Energy constraints may ease faster than expected. Power availability is the most commonly cited bottleneck for data center expansion, but the nuclear pipeline is materializing on an aggressive timeline. In the past 18 months, hyperscalers signed agreements for over 10GW of new nuclear capacity: Microsoft’s $16 billion deal to restart Three Mile Island by 2028, Google’s 500MW Kairos Power small modular reactor (SMR) fleet targeting 2030, Amazon’s $20+ billion Susquehanna campus conversion plus 5GW X-energy SMR pipeline. Regulatory timelines compressed after May 2025 presidential executive orders mandated 18-month maximum Nuclear Regulatory Commission (NRC) reviews for new reactors, down from historical 7-year processes.
If power becomes abundant sooner than expected, the primary constraint on supply expansion disappears. More data centers can be built and operated, which increases available compute and pressures pricing toward equilibrium. The power scarcity premium embedded in current rates erodes.
Both forces point the same direction: toward compute abundance arriving sooner than lenders modeled. Efficiency shrinks demand per unit of capability. Energy expansion grows potential supply. For AI adoption, these are positive developments. For financing structures betting on persistent scarcity, they compress the timeline.
Evidence of Stress in Specific Companies
Broad credit markets remain healthy—spreads are tight, capital is available, no systemic distress is visible. But within the specific segment of data center and GPU financing, stress signals have emerged.
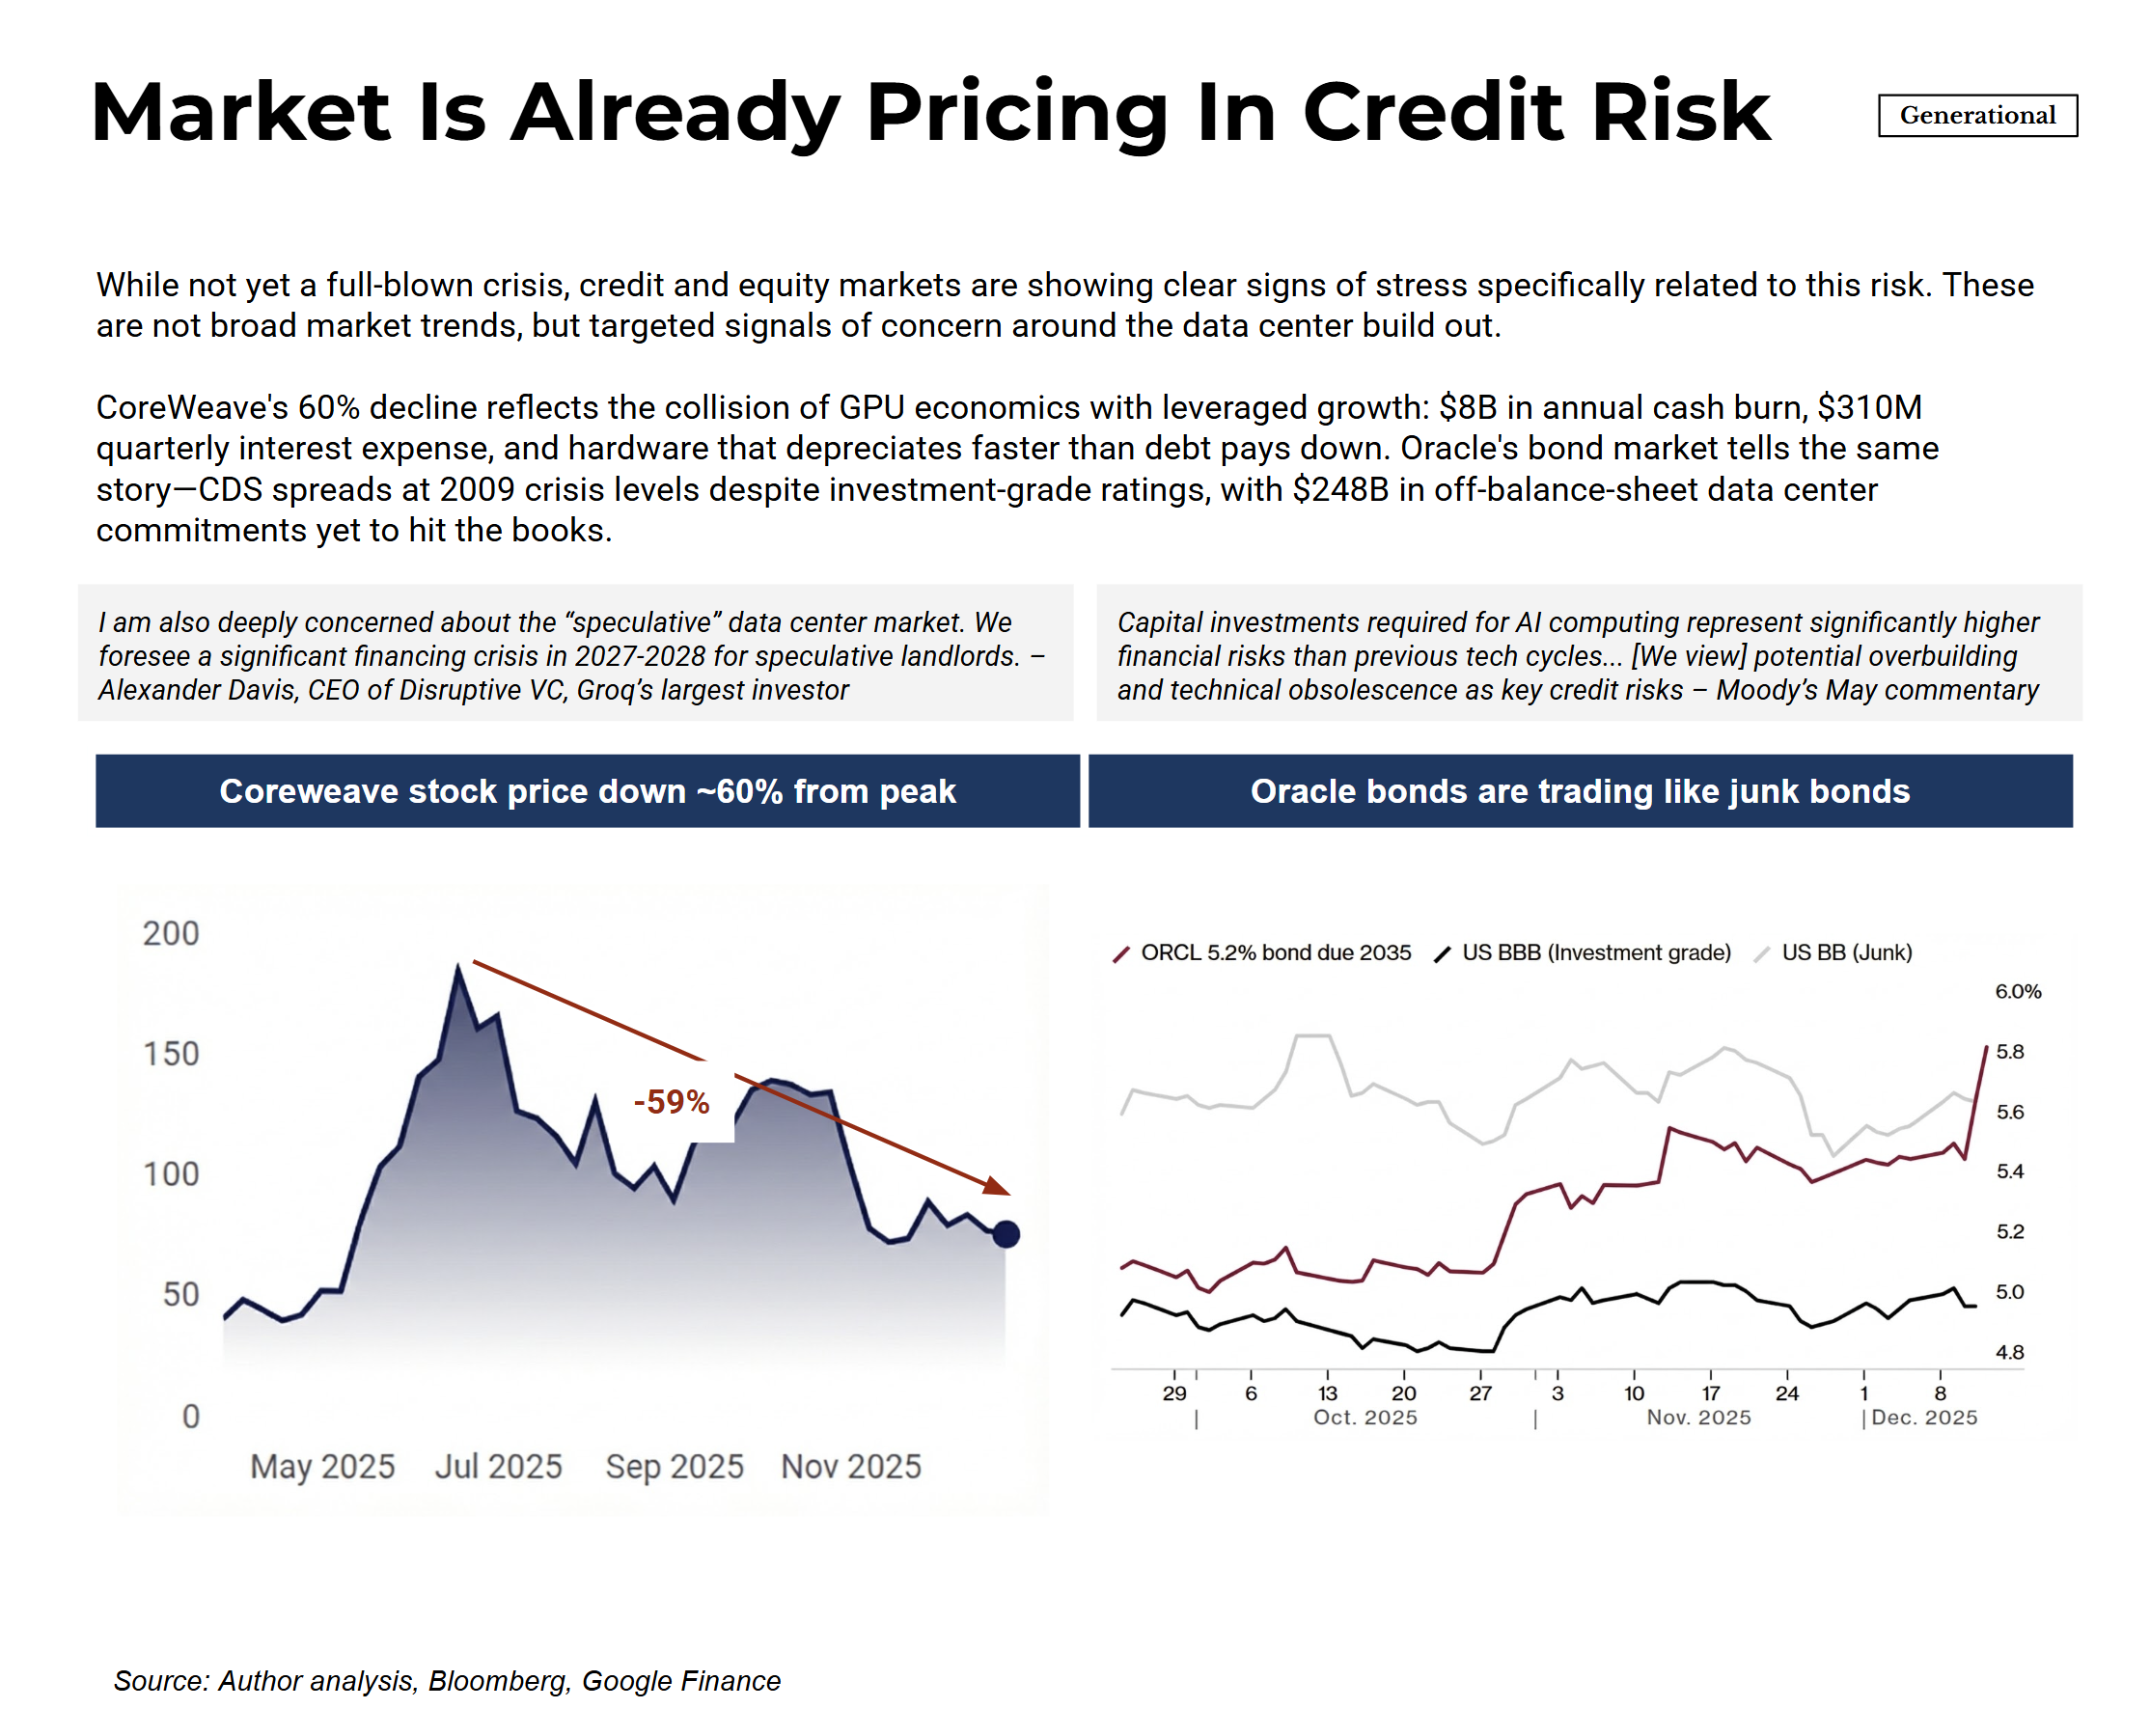
CoreWeave’s stock has declined approximately 60% from peak levels. The company exemplifies leveraged GPU economics. Financials from their Q3 2025 report:
+ $997 million gross profit
- $631 million depreciation
- $310 million interest expense
- $1,412 million quarterly debt repayment
+ $3,129 million in new debt issuance
I believe the stock price reflects investor reassessment of whether shortage pricing will persist long enough for the model to work.
Oracle’s situation is different but related. The company maintains investment-grade credit ratings, but its bonds due 2035 trade at yields closer to BB-rated (junk) than BBB-rated (investment grade) paper. CDS spreads have reached levels last seen during the 2009 financial crisis. The market is pricing specific risk around Oracle’s $248 billion in off-balance-sheet data center commitments—obligations that don’t appear on the balance sheet but represent real financial exposure.
To be clear: the hyperscalers will survive this. When Alphabet extended depreciation to six years in 2023, it boosted pre-tax income by $3.9 billion. When the writedowns eventually come, Alphabet absorbs an accounting hit—painful for the stock, but not existential. Alphabet has $96 billion in cash. The same applies to Microsoft, Meta, and Amazon. These companies have fortress balance sheets. They can afford to be wrong about depreciation schedules.
The risk sits one layer down: in the operators who financed GPU acquisitions with debt rather than cash flow. When CoreWeave faces the same depreciation math, the $310 million in quarterly interest payments don’t pause for accounting adjustments. The hyperscalers take writedowns. The leveraged operators can’t service their debt.
These aren’t signs of a broad bubble. Credit conditions overall remain accommodative. What they indicate is targeted concern about the gap between GPU economic lives and the financing structures built around them. The stress is appearing exactly where the depreciation thesis predicts—in leveraged operators holding older equipment against long-dated debt.
What This Is and Isn’t
The AI infrastructure situation doesn’t fit the pattern of a classic demand-side bubble. Demand is real, growing, and generating measurable economic returns. Traditional macro indicators show one warning sign (elevated valuations) against four healthy readings (profits, credit spreads, cash burn, leverage). The comparison to tulip mania or dot-com speculation mischaracterizes what’s happening.
The risk is narrower and more technical: financing structures built on the assumption that GPUs will retain economic value—the ability to generate cashflow—for 5-years, when competitive obsolescence arrives in 2-4 years. This works only if shortage pricing persists—and several forces are working to end shortage pricing sooner than the financing models anticipated.
If the risk materializes, the result wouldn’t look like a market-wide crash. It would look like credit impairments concentrated in GPU-backed lending, distress among leveraged data center operators, and margin compression for providers running older hardware. The stress would likely surface in credit markets first—in private loan defaults, securitized asset writedowns, and distressed refinancings—before rippling into equity markets as the hyperscalers eventually take the writedowns. This isn’t a prediction that stock prices won’t fall. It’s a view on sequencing: credit cracks first, equity follows. CoreWeave’s stock and Oracle’s bonds suggest markets are beginning to price this scenario.
The investors exposed to this risk are not the ones betting on AI. Its the ones betting on scarcity.
A Note on Michael Burry’s AI Thesis
Michael Burry —the investor who identified the subprime mortgage crisis before it unfolded and the person whom I’ve watched & read about a lot when I started my finance career—has been publishing detailed analysis of the AI buildout on his Substack, Cassandra Unchained. Having now gone through his writing carefully, we’re seeing the same thing—where we differ are more about emphasis than fundamental disagreement.
Burry’s analysis rests on several pillars:
Capital Cycle Theory. Burry presents historical data showing that stock market peaks tend to occur mid-buildout, often before capital expenditures peak. His chart of S&P 500 net capital investment divided by GDP shows this pattern across the dot-com boom, housing bubble, and shale revolution. The telecom bust wasn’t about demand being fake—internet demand was real. The problem was supply massively overshooting: by 2002, less than 5% of the fiber infrastructure built during the bubble was actually lit.
Depreciation mismatch. Hyperscalers have extended depreciation schedules from 3 years (2020) to 5-6 years today, while NVIDIA’s product cycles have compressed to roughly one year. This inflates earnings and overstates asset values. Burry documents this from 10-K filings and estimates double-digit billions of earnings overstatement for hyperscalers over 2026-2028. When Alphabet extended to 6 years in 2023, it boosted pre-tax income by $3.9 billion.
Economic obsolescence. Burry distinguishes physical utilization from economic value creation. NVIDIA’s CFO noted that A100s from six years ago are “fully utilized.” Burry’s response: “Just because a widget is used does not mean the widget is profitable to a degree that it is worth more than residual value.” The A100 uses 2-3x more power per FLOP than the H100. Blackwell is reportedly 25x more energy efficient than H100. An older chip can be running at full capacity and still be economically unviable.
Demand relative to CAPEX. Burry cites Menlo Ventures data showing application-layer GenAI revenue at $37 billion this year versus $400 billion in chip spending. ChatGPT has 900 million weekly users, but only 5% pay. His concern isn’t that AI has no demand—it’s that supply is being built far in excess of what current revenue can support. As he puts it: “One can believe AI is transformational and also believe that some public and private AI stocks are very overvalued.”
Credit risk. This is where our analyses converge most directly. In “Unicorns and Cockroaches,” Burry writes: “The big target for private credit now is AI data centers... there is a duration mismatch of catastrophic proportions between the asset and the loan.” In his Q&A piece, he adds: “There is a lot of leverage behind the data center buildout, and I believe bank and non-bank entities will be at risk if that buildout busts.”
Burry is clear about what he’s not saying: “I do not predict that Nvidia, Meta, Microsoft, Amazon, Alphabet are doomed. They all should survive. I believe some will survive like 2000 Microsoft did, some will survive like 2000 Cisco did.”
Where Burry and I align:
Where we differ in emphasis:
On demand, we weight the evidence differently. Burry emphasizes consumer app revenue and conversion rates. I weight enterprise deployment—the S&P 500 earnings disclosures are claims made under securities law, which I find harder to dismiss. But if he’s right that demand is weaker than I assess, that makes the credit thesis worse, not better. Less demand means faster arrival at equilibrium pricing, which means faster erosion of the shortage premium that makes the financing structures work.
One area Burry has developed that I haven’t fully explored: circular financing. He describes how tech giants invest in AI startups who then buy from them, and how “off balance sheet special-purpose vehicles” and “badly structured but easily obtained financing” are goosing GPU demand. To the extent this is true, it amplifies credit risk—loans underwritten against demand that’s partially self-referential are even more exposed when capital stops flowing.
One final thought. Burry made his name by poring through individual mortgage loan files—finding the misaligned incentives and mispriced risk that aggregate data obscured. He saw what the rating agencies and institutional investors missed because he did the granular work.
The same opportunity exists here. The nearly $1 trillion in private credit and securitized assets projected to finance GPU infrastructure contains specific assumptions about depreciation schedules, collateral valuations, residual values, and covenant structures. Someone with access to those documents—the actual loan files, not the marketing materials—could identify which pools are most exposed and how the risk is distributed.
Burry notes he plans to address financing, circular deals, and “a curious liability hiding in the financial statements” in his Part 3. I’ll be reading carefully.
That work remains to be done. I’m curious what he finds.
I believe CoreWeave has a high probability of filing for Bankruptcy in 2026. The business is in far worse shape today than the public knows. Here are 5 key issues it is facing that cumulatively will lead to its insolvency next year.
1. The Cashflow Problem
A major problem CoreWeave has is its cashflow. CoreWeave sold its future to fund its growth. Customers have already pre-paid, and the money they paid is already spent. For Example, Open AI has prepaid over $2 Billion to CoreWeave for credits that it will slowly burn through over 2 years. While CoreWeave will recognize that $2 billion as revenue they will get no cash from Open AI as Open AI will just be burning through credits. The $5.3 Billion in deferred revenue on CoreWeaves balance sheet will go down, and revenue will be recognized, but they will get no cash until those pre-paid credits are used up. This leaves no cash for CoreWeave to pay its operating expenses, or pay its amortized DDTL Loans, much less continue the $28-30 Billion in Capex they have forecasted. They are almost certainly going to have to lower the Capex and renegotiate the contracts they have with customers to survive this. While reported revenue numbers will look good the company will be in great financial stress.
2. The Credit Problem
They already have junk status with all the major rating agencies, and CDS spreads are projecting a 42% chance of default in the next 5 years (I think it is closer to 45% this year). They have $3.7 billion in current debts due 12 months from September 30th, 2025 (per the most recent 10q). Based on table 10. “Debt” in the 10q about $2.6 billion of that is amortized payments on its DDLT loans and the other is a large balloon payment of OEM Financing Arrangements from Nvidia and Dell. They have the maturities of these financing arrangements listed as due March 2026-August 2028 but given the amount of current debt they show this is extremely misleading. Almost 100% of the OEM financing debt is due in the first half of 2026. Keep in mind that as of September 30th the DDTL loans are not fully drawn, and that amortization payments on those loans start Q1 of 2026. When those loans are fully drawn current debt will rise dramatically.
Having said all of that, they do not have near enough cash to cover these payments along with operating expenses, which is why they had to have their minimum liquidity levels lowered to $100 million to avoid technical default. Furthermore, they have cross collateralized the DDTL loans with the entire company. This will likely prevent them from being able to issue more bonds or convertible bonds. This cross collateralization gives the DDTL lenders first position on chips and either first position or equal position to bondholders on the rest of the company.
This is why they need unlimited equity cures to get through the next few months. They need to be able to print stock to not default on DDLT Loans. This is all noted in the 8k reported in early January discussing the modification of CoreWeave’s DDTL loans.
3. The Equity Problem
I can send you a PDF that goes into greater detail on this, but basically the founders are converting founders shares into sellable class b shares at a clip of about 9 million shares a quarter. On top of this Magnetar, a big early investor, is selling about 27 million shares a quarter, and Magnetar along with the 3 founders already have presold shares in a VPF contract that will hit the market on June 19, 2026. In addition to this they have a 6% evergreen provision that automatically adds 6% of the total share count on Jan 1 that goes to help employees. (5% Equity and 1% Employee Stock Purchase Plans) Another 29.8 million shares. They will also need to print at least 62 million shares (assuming the stock prices stays around $78) just to survive the year. In reality they probably need much more but let’s be conservative. That means with insider selling and new shares issued, the new supply of shares will be close to 215 tradable shares. Just newly printed shares will be around 91 million. With current outstanding shares at 497 million existing shareholders will be diluted by at least 18% and the tradable share float will go up 43%. Not great for existing shareholders.
4. The Contract Execution and Construction Timing Problem
The fourth problem they have is their inability to meet deadlines and deliver on contracts. They have strict contract realization deadlines that they have to meet to secure DDTL Financing. They have to show billings by February 28, 2026, to be able to collect the remaining money on the DDTL Loans. The big one is the DDTL 3.0 loan for the Denton Open AI Facility. They cannot actually get the money from the DDTL Loan to pay suppliers until they show revenue, but they are 60-90 days behind schedule. They have cited “Weather Delay” which I believe to be totally bogus. The real reason for the delay is the redesign of the facility to meet the liquid cooling requirements of the new Blackwell chips.
Having said that, the Shell for the Denton facility was delivered to CoreWeave per The Texas Department of Licensing and Regulation permit issued on December 29th, 2025. (See the link to the permit below.) This was the final step for Core Scientific, the landlord to deliver the shell and begin collecting lease payments. It will take 5-6 months potentially to build out the facility, and to get all the chips up and going. This means that they will not be able to bill Open AI for at least 5 months. If they cannot get the facility up and running by March they will have to start paying Open AI penalty payments in the form of compute credits, if they do not have it up and running by May 1, 2026 Open AI can cancel the Denton Contract, and if it is delayed until July 1, 2026 they can terminate all deals with Coreweave. I do not believe Open AI will cancel the deal because they have already pre-paid for so much compute at such low rates. The penalties could add up to a significant number though for Coreweave further pushing out its cashflow.
The timing is a big problem for CoreWeave’s cashflow. This is where the unlimited equity cures come in. They cannot bill open AI because they are not finished installing the chips, and they cannot get the money from the DDTL loans to pay their suppliers until they bill Open AI. So, what the banks have allow them to do is substitute these “Billings” with stock sales to the open market to generate cash that will give CoreWeave liquidity to pay the banks. This is not an option. They have to do this to get their money even if they have cash in the bank to pay the loan. If they do not issue equity cures to replace billings the bank will not fund the remaining portion of the DDTL Loans. The Denton facilities billings alone are estimated to be around $100 Million /month conservatively. That means at a minimum $100 million in stock that must be issued per month of delays just to satisfy the banks and get funding. This is just for the open AI Denton, TX project. CoreWeave has 3 of these going at the same time in similar stages. Their sites at Ellendale, ND and Lancaster, PA are also experiencing similar delays.
In my opinion construction delays and contract timing risk are potentially the biggest of all the issues CoreWeave has in the short term. They could blow everything up very quickly.
5. Their Margins Suck
For this I lean on others’ research. The Kerrisdale Capital Report posted on September 15, 2025, lays everything out pretty well. Micheal Burry also has a similar view that the depreciation schedule companies are using for these chips is far to long. Basically, what they say is that reported margins are roughly 20% based on a 6 year chip life cycle, but margins are essentially 0% because the chips only actually last 4 years. Also, CoreWeave will not realize any free cashflow from its chips for 3 years due to harsh amortization schedules and high interest rates on its DDTL loans. By the time they get the DDLT loans paid off they will have made 0 money on their chips, and they will basically be worthless.
Kerrisdale Report
https://www.kerrisdalecap.com/wp-content/uploads/2025/09/Kerrisdale-CoreWeave.pdf
Employee Benefit Plan Filing
https://www.sec.gov/Archives/edgar/data/1769628/000119312525058309/d899798dex103.htm
The Texas Department of Licensing and Regulation Permit
https://www.tdlr.texas.gov/TABS/Search/Project/TABS2025005706
Thanks for the writeup, however I feel it's a little bit missing the forest from the trees.
What I mean by this is that certain basic but important angles are not raised.
It is mentioned that the revenue is not proportional to the capex. But it should be also mentioned that the revenue generated is inflated by massive subsidies. If OpenAI and Anthropic generate more than 50% of the LLM-revenues, but they lose a lot of money doing that, a large share of the revenue and revenue growth is kind of fake, because it is artificial demand spurred by lower than natural prices. It should be added that the other providers also run at a loss.
I would also be curious that the supposed productivity growth mentioned in the article, well, do we know how much is spent on that, and exactly what sort of gain is attributed to it? Even if a process that takes up a 1/10000th of a company's total value creation workflow is tripled in efficiency, it is not going to drive a significant difference, and it won't be worth a lot of money to spend on for the company (overall).
So it seems like there is a massive TAM, which might not exist at all.
As a note: with LLMs being not actually intelligent, and prone to providing false but plausible-looking information, are we even sure that it actually drives growth that would not be invalidated later as problems down the line come up and compound?
And one more important thing that the writeup partly addresses but still does not: if LLMs are not the best architecture, or their algorh. efficiency increases, the whole superlarge compute buildup would be just a massive waste of resources.
This is a large gamble that actually looks more and more like it surely won't pay off.